

The most exciting thing about the Top500 rankings of supercomputers that come out each June and November is not who is on the top of the list. That’s fun and interesting, of course, but the real thing about the Top500 is the architectural lessons it gives us when we see new systems emerge on the Top500 and we get to see how choices of compute, memory, interconnect, storage, and budget all play out at a system level and across nations and industries.
We would normally walk through the top ten machines on the list and then delve into the statistics embodied in the Top500. This time around, we have assembled a more usable feeds and speeds of salient characteristics of the top thirty machines on the list, which we feel is representative of the upper echelon of HPC supercomputing right now.
But first, before we do that, it is appropriate to just review the performance development of the top and bottom systems that are tested using the High Performance LINPACK benchmark and the total capacity represented in the entire list between for the past thirty years that the Top500 rankings have been compiled.
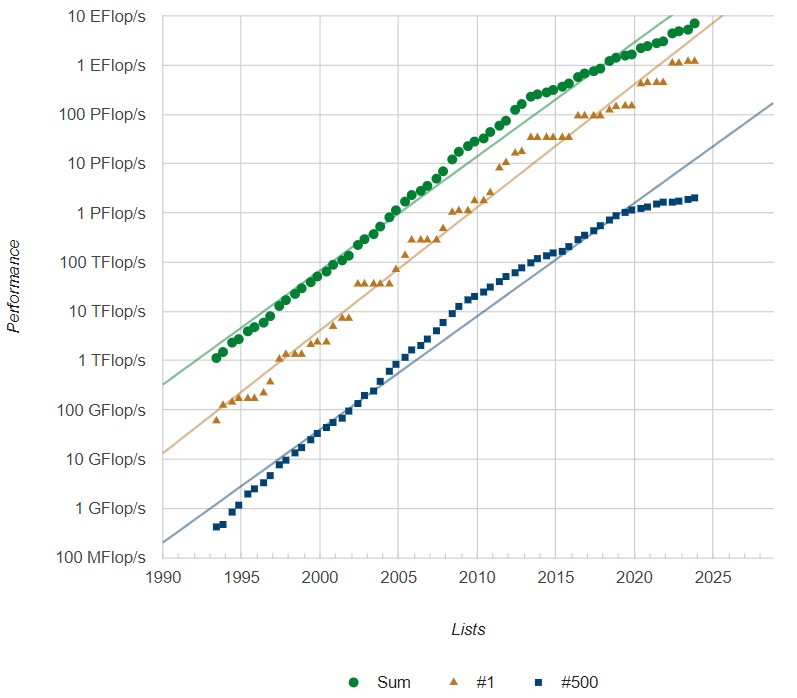
We have certainly strayed from the Moore’s Law curve that taught us to expect exponential performance increases. And it is fair to say that we have a very lopsided market – at least if you think those who submit HPL test results to the Top500 organizers are representative – with some very large machines comprising a large portion of the aggregate compute capacity on the list and a slew of relatively small machines that are nowhere near as powerful making up the rest.
A treemap of systems by architecture, created by the very clever Top500 database and graphing software, shows visually just how lopsided this is, with each square representing a single machine and each color representing a particular compute engine choice in the November 2023 rankings:
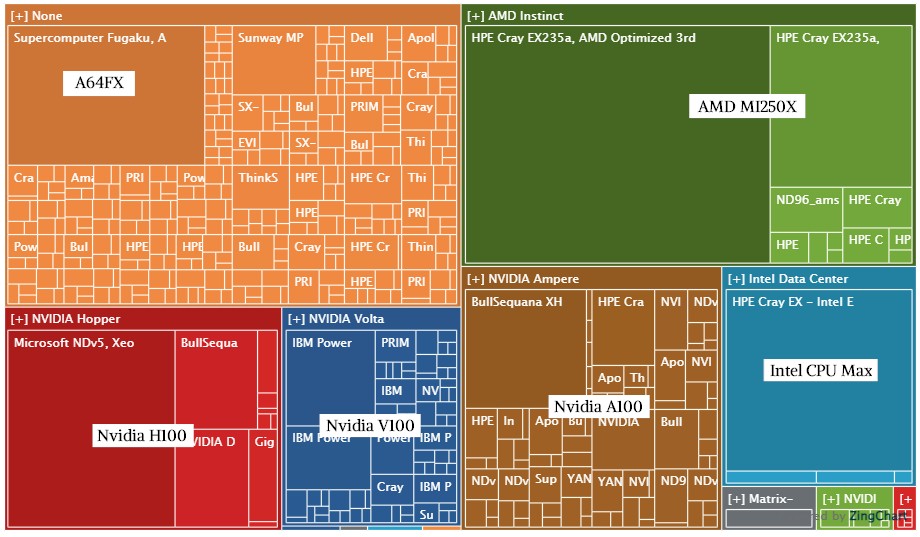
Going clockwise from the upper left, the big burnt orange square is the “Fugaku” system at RIKEN Lab in Japan based on Fujitsu’s A64FX Arm chip with big fat vectors. The olive green/brownish color in the largest square is the Frontier machine (hey, I see in color, I just don’t necessarily see the same colors you might) and the lighter version of this color is the AMD GPU neighborhood. The blue square at five o’clock is the half of the Aurora system that has been tested, and that purple area just below it is the “TaihuLight” system from 2016 based on the Sunway SW26010 processor (similar in architecture to the A64FX in that it is a CPU with lots of vector engines) at the National Supercomputing Center in Wuxi, China. The Nvidia A100 neighborhood is immediately to the left, with the “Leonardo” system at CINECA in Italy built by Atos being the largest square in this hood. The blue neighborhood at 6:30 as we move around is not just IBM, but includes the pre-exascale “Summit” machine at Oak Ridge and the companion “Sierra” machine at Lawrence Livermore National Laboratory. On the lower left you see that a new Microsoft machine called “Eagle,” which is running in its Azure cloud, is not only the third largest supercomputer in the official Top500 rankings but is also the largest machine using Nvidia’s “Hopper” H100 GPU accelerators.
As you see in the performance development chart above, the addition of some new machines among the top thirty machines has helped pull the average aggregate 64-bit floating point performance of the biggest 500 systems to submit results upwards. Notably, this includes the long-awaited “Aurora” supercomputer built by Hewlett Packard Enterprise with CPU and GPU compute engines from Intel and the Slingshot interconnect from HPE. Or rather, it includes around half of that machine, which has just a tiny bit over 2 exaflops of peak theoretical performance and which is, as happens with any new architecture, going through a shakedown period where it is being tuned to deliver better computational efficiency than its current results show.
The ”Frontier” system at Oak Ridge National Laboratory, comprised of custom “Trento” Epyc CPUs and “Aldebaran” MI250X GPUs from AMD all lashed together with HPE’s Slingshot 11 interconnect, remains the number one system in the world ranked by HPL performance. But there are two and possibly three different machines installed China that might rival Frontier and a fully tested Aurora machine. We have placed them unofficially on the Top 30 list, initially using the expected peak and HPL performance as assessed by Hyperion Research two years ago and then we just updated the table with better estimates of their current performance, so we can reflect reality a bit better.
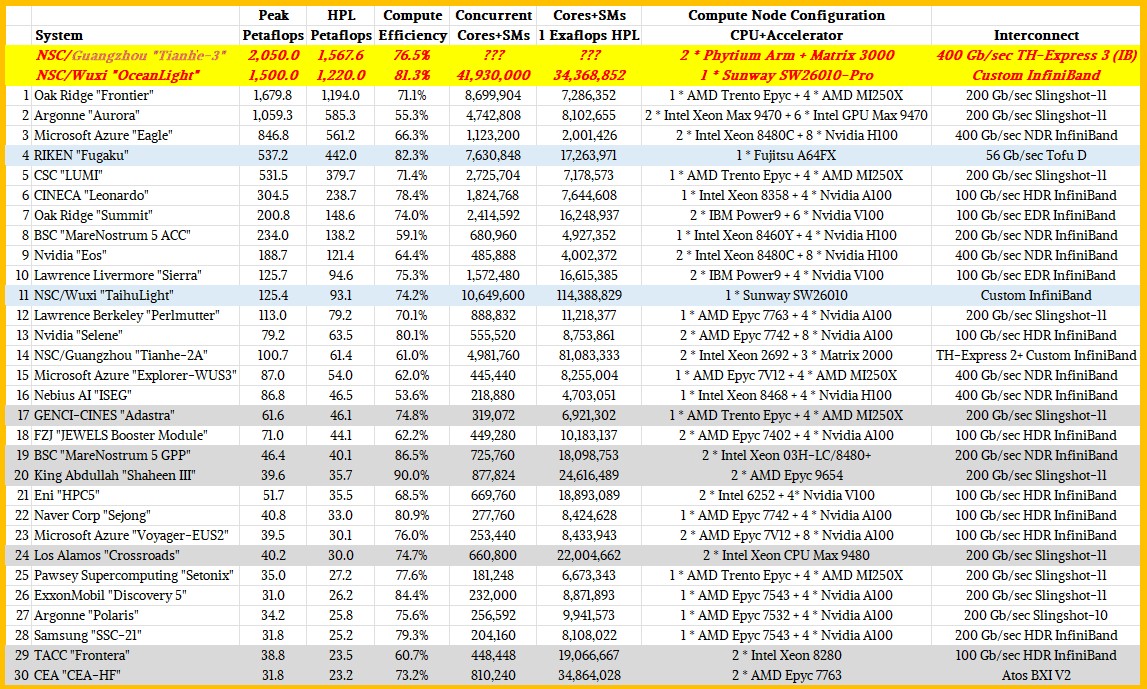
In the table above, the machines with light blue bars are using special accelerators that put what is in essence a CPU and a fat vector on a single-socket processor. Fugaku and TaihuLight do this, and so does OceanLight. The machines on the gray bars are CPU-only machines or partitions of larger machines that are only based on CPUs. The remaining 22 machines (not including the two Chinese exascalers in bold red italics and in the yellow bars) are based on hybrid architectures that pair CPUs with accelerators, and most of the time the accelerator is a GPU from either Nvidia or AMD.
If China published the test results for the “Tianhe-3” system located at the National Supercomputing Center in Guangzhou, and if the rumors are right, then this machine has 2.05 exaflops peak performance and somewhere around 1.57 exaflops on HPL. And that would make it the number one system in the world for the past several years, as we reported two years ago before SC21. The OceanLight system at NSC/Wuxi weights in at 1.5 exaflops peak and around 1.22 exaflops on HPL as far as we can tell from rumor and double-checks based on several papers that have been published about this machine. That makes them both more powerful than Frontier.
Considering that the compute engines in supercomputers are all expensive, we are always particularly interested in the computational efficiency of each machine, by which we mean the ratio of HPL performance to peak theoretical performance. The higher the ratio, the better we feel about an architecture. This is one of the few datasets that allows us to calculate this ratio across a wide array of architectures and system sizes, so we do what we can with what we have, but we know full well the limitations of using HPL as a sole performance metric for comparing supercomputers.
That said, we note that at 55.3 percent of peak, the HPL run on the new Aurora machine – or rather, about half of it – was not as efficient as Argonne, Intel, and HPE had probably hoped. We estimated back in May of this year that with a geared down “Ponte Vecchio” Max GPU running at 31.5 teraflops, with 63,744 of them in the Aurora machine, would deliver 2.05 exaflops of peak. At that low computational efficiency, the Aurora machine fully scaled out would only hit 1.13 exaflops on the HPL test, which is less than the 1.17 exaflops that Frontier is delivering. At somewhere around 65 percent computational efficiency, Aurora should hit 1.31 exaflops, and at 70 percent, it could hit 1.41 exaflops.
We think Aurora will get more of its peak floating point oomph chewing on HPL as Intel and HPE test the machine at a fuller scale. This is Intel’s first version of its Xe Link interconnect, which used to hook the Max GPUs to each other and to the “Sapphire Rapids” Xeon SP HBM processors in each Aurora node. Nvidia has shipped its fourth version of NVLink and AMD is on its third version of Infinity Fabric. These things take time.
There are a few other machines in the top thirty of the November 2023 list that are below the average computational efficiency. And it is not like other machines didn’t start out at this level (or lower) before and sometimes even after their first appearance on the rankings. For instance, we heard a rumor as we were awaiting Frontier’s appearance that it was well under 50 percent computational efficiency, which is why we didn’t see it when we expected it. In this case, there was a new CPU, a new GPU, and a new interconnect that all had to be tuned up together at scale for the first time. Ditto for the accelerator cluster (ACC) portion of the “MareNostrum 5” system at Barcelona Supercomputing Center in Spain or the “ISEG” system at Nebius AI in the Netherlands.
We expect for CPU-only machines to be more efficient because there is one fewer layer of networking involved. And indeed, if you average the computational efficiency of the eight CPU-only machines in the top thirty, you get 77.1 percent of peak flops for HPL, while the accelerated machines average 70.3 percent.
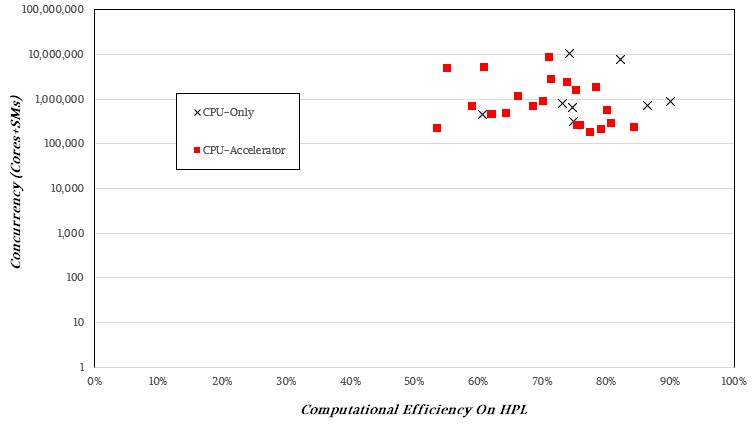
There doesn’t seem to be a discernable pattern if you plot computational efficiency across concurrency, so it is not like higher orders of concurrency mean lower computational efficiency:
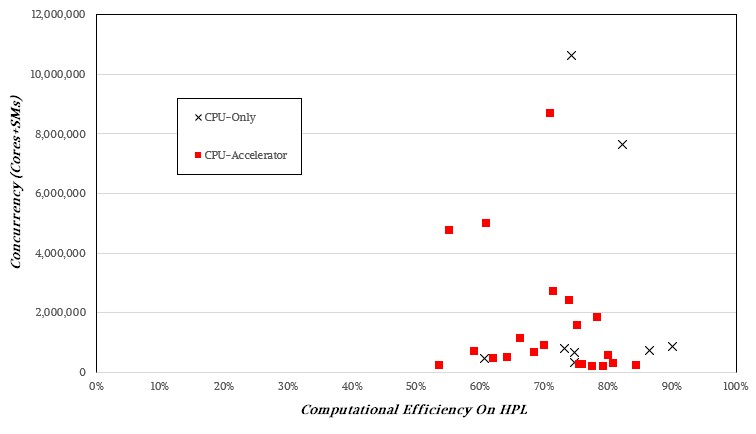 The CPU-only and hybrid architectures vary widely in their computational efficiency on the HPL test, and we strongly suspect this has as much to do with tuning experience as it does architecture. Very likely more.
If you plot this on a log scale, there is no pattern that pops out, either.
 Sometimes, knowledge is knowing what something isn’t rather than what it is. Higher bandwidth and lower latency – and predictable latency at that – seem to be what drives performance. Anything above 75 percent is commendable, anything about 80 percent to 85 percent is amazing. And with 90 percent computational efficiency on the CPU-only “Shaheen III” cluster, we want to know what magic tricks the techies at King Abdullah University in Saudi Arabia are doing. We ain’t seen anything like that since the “K” supercomputer at RIKEN Lab a decade ago.
We would also like to know, of course, if there is any correlation between HPL performance and real HPC simulation and modeling workload performance. For a lot of workloads, the HPCG benchmark, which chews up exaflops and spits them out with just terrible levels of computational efficiency, is probably a better gauge. And that is a bitter pill to swallow.


Superb analysis! It reminds me of assigning student grades at the end of the semester, 90-100% = A, 80-90% = B, 70-80% = C, 60-70% = D, below 60% = F — and C is the passing grade (for the course to count in the student’s Engineering curriculum). In this Top30-of-500 list then (the honors class of high-achieving gemstone students), all systems with H100 get a grade of D or less (max efficiency = 66.3% in Eagle Azure). Sleeping Beauty gets an F, the swashbuckling buccaneer gets an F (no show), and Santa’s red-nosed rocket sleigh also gets an F (also a no show)! Shaheen’s the only supercomputing student to get an A!
I think this class will need a bonus homework project assignment (punishment) to fine-tune its performance a bit more! If we look for example at the middle of the pack, say student #293, Henri Oh (aka Oh’Henri, with its H100), its performance and focus greatly improved with just an extra 6-months of finetuned tickling torture (Spanish Inquisition-style), from 38% (Nov.22) to 80% (Jun.23) … One can only hope that the same happens to the rest of these high-achieving misfits! 8^b
Good work as usual, Tim!
A minor correction: Tianhe-3 is at 2.05 Exaflops full config (2 years ago), while the Alpha++ one is 1.5 Exaflops Rpeak and 1.22 Rmax (already a 3 years old system by now, mind you)
Can you point me to any cite for these numbers? I went off of what Hyperion said two years ago because that is what I had. I made my own estimates, but those are not “facts.”
Thanks Tim, Hyperion was relying on early rumoured info which wasn’t correct. This is the final info I believe never published in the Western press – however here’s the example for the No 2 system, which won the Gordon Bell Prize with that quantum supremacy stuff:
105 cabinets x 1024 CPUs x 390 cores. 14.26 P FP64 per cabinet.
The numbers for the No 1 were verbally mentioned at HPC China conference last month. Nothing official on it, and the information disclosure will just get worse due to the ongoing sanctions warfare… that includes a few half-Exa class systems coming up
Yup, I wrote up the GBP thing and should have used my own numbers on OceanLight. I updated the table to show Tianhe-3 as “above the number 1 system”. Ahem.
Thanks for helping.
This international competition is SuperTrooper! Without it we might end-up lazily sitting on a throne of laurels, without much pushing of the brain-gut axis, resulting in reduced innovative throughput!
The OceanLight team will present its 5 EF/s HPL-MxP result tomorrow ( Wednesday Nov. 14: https://sc23.conference-program.com/presentation/?id=pap103&sess=sess160 ) and their paper is OpenAccess ( https://dl.acm.org/doi/10.1145/3581784.3607030 ), yes! Frontier does 10 EF/s on HPL-MxP which keeps the competitive pressure on full-tilt, for even more innovation! q^8
Speaking of GBP, Sarat of E3SM SCREAM! just commented (back on the GBP TNP piece https://www.nextplatform.com/2023/09/15/chinas-1-5-exaflops-supercomputer-chases-gordon-bell-prize-again/ ) that their very detailed and impressive physically-based (PDEs) whole-earth 3.25 km horizontal-resolution cloud-cover prediction presentation (128 vertical nodes, 10 billion parameters for physics + dynamics, MI250x ROCm and V100 CUDA) is also Wednesday (morning) Nov. 15 ( https://sc23.conference-program.com/presentation/?id=gbv102&sess=sess298 ) with Open Access paper ( https://dl.acm.org/doi/10.1145/3581784.3627044 ). A must see by all accounts!
Interestingly, the European equivalent to SCREAM! is the model named EXCLAIM! (go figure!)! (eh-eh-eh!)
There’s something odd about Henri’s increase in HPL efficiency. From its introduction in November 2022, to its second listing in June 2023, Its Rmax and Power both went up by 1.4x, but its Rpeak went down from 5.42 to 3.58 PF/s. I don’t understand how this is possible (unless some Rpeak reporting involved a typo?) ( https://top500.org/system/180087/ ).
That smells like a typo to me….
Of course efficiency for a completely synthetic benchmark that doesn’t tax the memory or network – it’s a little indicative of how effective the machine is for real world codes, but not much. I think the linpack efficiency is often an indication of how long the machine stays up without losing a node.
I would hope it is more useful than that!
HPL-efficiency may be a bit of a brute-oomph way to grade those supers but it seems fairer than using HPCG-efficiency (very tough grader), or HPL-MxP-efficiency (way too easy grader). The top HPCG-efficiency is likely that of the new NEC vector-motored AOBA-S which gets 1.09 PF/s out of a 19.8 PF/s Rpeak, or 5.5% efficiency score. All others being less than that, all systems get a grade of F (very tough grading). Conversely, HPL-MxP results in perfs that are above Rpeak (hopefully!) and all systems get A grades just for attending (overeasy grading)!
Meanwhile, it is entirely true (in my mind) that we need to develop better ways of optimizing machine operation simultaneously over the 3 axes of memory latency, bandwidth, and capacity. The PIUMA HIVE likely gives some pointers on how to improve graph performance (latency) and the challenge would be to weave those into contemporary computational karatekas ( https://www.nextplatform.com/2023/09/01/what-would-you-do-with-a-16-8-million-core-graph-processing-beast/ ).
I think staying up without losing a node is important. How much wall time do these exascale HPL computations take anyway?
I’m confused why the A64FX is said to be “using special accelerators that put what is in essence a CPU and a fat vector on a single-socket processor.” I thought the Scalable Vector Extension on the A64FX were 512-bit wide. Isn’t that the same width as AVX512 on the Xeon?
Maybe the difference is the integrated HBM? But now Xeon MAX also has that.
I appreciate your analysis and find it amazing how much fun people have with the high-performance Linpack. Whether a relevant indicator for practical computation or not, HPL is still a good stress test to make sure the hardware works and meets design specifications.
They were fat for their time, I suppose. I would like 1,024-bit vectors. HA!
Speaking of which, it was ironically mentioned to me recently that the costs of building power infrastructure for a linpack run could be saved, since we never run the machine that hard again after acceptance.
This Top500 list sure has the most of hopscotch-leapfrogging around expectations I’ve seen in a while … but I’m glad Aurora (sleeping beauty) came out of its coma after being kissed by skunkworks engineer(s), even if it’s not yet in 100% shape. Doing the 585 PF/s tango on a first outing with all new glitter and gear (SR+PV) is nothing to be ashamed of in my mind (#2)!
Cloud HPC, that, on the face of it, seemed like a very dumb idea recently, is apparently not that bad at all with MS’ Azure Eagle machine hitting that very impressive 561 PF/s on HPL (#3)! Nvidia’s Eos SuperPOD (#9) also looks interesting as a pre-built 121 PF/s system that you can just buy, plug-in, and run (I guess), rather than having to go through months of instrument tuning and qualifier exams (as in that next log10 perf level: Exaflopping)!
And who could have ever expected the dual Spanish Inquisition minds of MareNostrum 5 ACC and GPP (#8 and #19) that convert HPC unfaithfuls (with surprise, ruthless efficiency, and torture by pillow and comfy chair) at a combined rate of 178 PF/s!?
The list is completely different from my expectations, but a great one nonetheless! Congrats to all, and especially the new entries!
I join you in your congratulations, and add to them the 3 new CPU-only systems that are in the Top-25 for both HPL and HPCG:
MareNostrum 5 GPP (Xeon), Shaheen III-CPU (EPYC), and Crossroads (Xeon)
Easy to program, flexible, and powerful, what’s no to like!
Very loud congratulations to everyone in the 19-member Exascale SCREAM team (Taylor, Guba, Sarat Sreepathi, …) for winning the first ACM Gordon Bell Prize for Climate Modelling! (now awarded: https://awards.acm.org/bell-climate , https://sc23.supercomputing.org/program/awards/ )!
Keep up the great work, all the way to 1 km at 10 EF/s, and beyond!
Hubert, it is notable, I think, that Frontier already gets 10 EF/s in HPL-MxP and so there should certainly be hope for 1 km, even today (networking seems ok). Converting SCREAM to mixed-precision might be a demanding task, but should be well worth it in the long run, especially if the so-developed methods also apply broadly to other models. From such efforts, NOAA could finally get its 1000x Cactus and Dogwood (#75-76 at 10 PF/s) for 1-km forecasts ( https://www.nextplatform.com/2022/06/28/noaa-gets-3x-more-oomph-for-weather-forecasting-it-needs-3300x/ )!
The new 40 million-core Sunway team is also doing well here with 5 EF/s in MxP (SC23) described in detail in Open Access ( https://dl.acm.org/doi/10.1145/3581784.3607030 ) which should be good for 1.4 km x-y grids. The EU’s LUMI and Japan’s Fugaku, at 2.4 and 2.0 EF/s MxP, respectively, might do nicely at around 2 km of horizontal resolution.
Hopefully, SCREAM’s vertical-Hamiltonian, horizontal-spectral, and temporal IMEX high-CFL RK, provide a bounty of opportunities for accurate, effective, and stable mixed-precision implementations.
The 10 EF/s 1-km goal also makes me wonder if anything interesting might have come out of last year’s DOE/Oak-Ridge “Advanced Computing Ecosystem” RFI, aimed at that performance range ( https://www.nextplatform.com/2022/06/30/so-you-think-you-can-design-a-20-exaflops-supercomputer/ )? If MxP were to give a 5x to 10x speedup on those, we’d be looking at 100 EF/s of practical effective oomph (one full tentacle of ZettaCthulhu! eh-eh-eh!)!
Congratulations to all future HPC professional experts who took part in the SC23 Student Cluster Competition (Smackdown: https://www.studentclustercompetition.us/2023/index.html)! Congrats to the Indy winners in Zhejiang, Finland, and Córdoba! Congrats also to the Peking Radiance of Weiming team (EPYC9654+A800) that won HPL (182 TF/s) and MLPerf (tie), the Tsinghua Diablo team (Xeon8490H+H100) that won HPCG (3 TF/s), and the UCSD Triton LLC team (SuperMicro EPYC9654+MI210 mini-Frontier) that won MLPerf (tie)!
Mostly though, in the spirit of HPC Gastronomy, a hearty digestive congratulation to the SCC23 Overall Winning team:
The 4-node Piora Swiss Cheese Racklette Fondue (Milan+A100), from ETH Zürich
(kid you not!) Bon HPC appétit!