

It may have taken a while for the transition to 200 Gb/sec and 400 Gb/sec networking to take off in the datacenter, but this higher gear to switching is finally kicking in and delivering unprecedented bang for the buck in networks, and in fairly short order at least compared to sluggish pace that 100 Gb/sec Ethernet took getting into the datacenter.
The engineering challenge of making a cost-effective and power efficient 100 Gb/sec switch was the barrier, and that is how we got stuck with the interim stepping stone of 40 Gb/sec between 10 Gb/sec and 100 Gb/sec speeds in the first place. And all that difficulty in getting faster signaling rates and new signaling techniques such as pulsed amplitude modulation (PAM) to cram more bits onto a signal have laid the foundation for 200 Gb/sec, 400 Gb/sec, and faster speed jumps on the Ethernet roadmap. And thus hyperscalers, cloud builders, service providers, telcos, and large enterprises are now starting to deploy this technology as they upgrade their networks for ever-heavier message passing.
We know this generally from talking to the switch ASIC and switch makers of the world, but we calculate it empirically thanks to the very good set of data that IDC makes available to the public each quarter concerning the global Ethernet switching and routing markets. (IDC used to do the same thing for servers and storage, but has gotten stingy with that data since Q3 2021, much to our chagrin.) This Ethernet networking dataset was recently updated for Q1 2022, and we have poured over the details and plugged it into our monster historical spreadsheet to take a look at the trends in revenue streams, cost per port, and cost per bit shipped over the line for various classes of devices.
In the quarter ended in March, IDC reckons that $7.62 billion in switching gear was sold into the datacenter and the campus environments. That was an increase of 12.7 percent compared to the year ago. (We are not sure how IDC is counting edge switching as yet, but it is probably merged into the campus data to keep the datacenter segment pure.) Sales of routing equipment, which is used to glue networks to each other, usually over metro distances or between local datacenters within regions as well as out in the edge (such as in our homes, where we have routers on the Internet, not switches), rose by 3.5 percent to $3.58 billion.
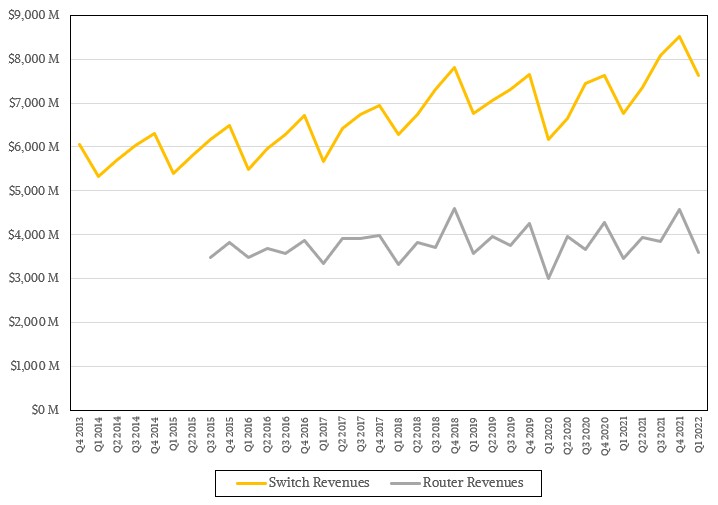
As you can see from the chart above, sales of routing equipment just bounces along, more or less like a heartbeat since IDC first divulged its first casing of the router market in Q3 2015. The switching data goes back two more years, and as you can also see, it has kind of sawtoothed its way up and to the right, and frankly, the line between switching and routing at the hardware and software has been blurring for years as routing functions have been added to merchant ASICs and we think that it is fair to say that some of the growth in Ethernet switching is due to these hybrid ASICs (like the “Jericho” family from Broadcom) and the devices that use them, which are often doing routing functions.
We just report the data we find, characterize it as best we can, and supplement with estimates to fill in gaps when we must.
We have definitely had to estimate the revenues and port counts for the 200 Gb/sec and 400 Gb/sec categories of Ethernet switching, based on the sparse statements that IDC has made. And as 40 Gb/sec switching as fallen out of favor, we have had to fill in that gap as well. The publicly available data is also weak for the campus gear running at 2.5 Gb/sec and 5 Gb/sec speeds, so we have to fill in the gaps a bit to make all of the data line up.
It is hard to believe, but 1 Gb/sec Ethernet switches still make up the largest part of the switching market, with 31.4 percent of overall sales and comprising $2.93 billion in revenues in Q1. (There is a lot of this gear on the campus.) The second largest portion of Ethernet switching comes from 100 Gb/sec devices, which represented 26.7 percent of revenues, or $2.03 billion, in the period and goes mostly into the datacenter and campus backbone. And 10 Gb/sec devices make up the third largest portion, with 19.5 percent of the market, or $1.49 billion in sales. Revenues for other speeds of switches are not explicitly given by IDC, so you have to calculate them based on sequential or annual rates given. But the point is, they are given and you can do the math.
When you do all of that math, and then do the same thing for port counts and then aggregate the bandwidth across the tiers of speeds, here is what the first quarter of 2022 looked like for Ethernet switches:
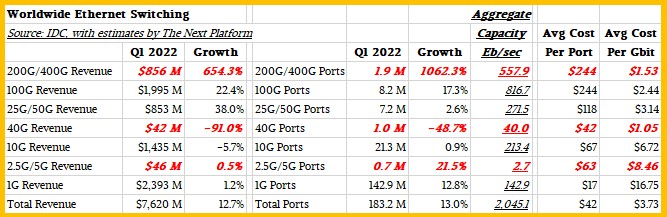
The figures shown in red bold italics are estimates, but we think fairly good ones for whatever that is worth. As you can see, sales of 200 Gb/sec and 400 Gb/sec devices are on that hockey stick rise switch makers have been waiting for, not exactly patiently. The aggregate capacity sold against a fairly modest number of ports is absolutely enormous, with these high speed switches comprising a little more than 1 percent of the ports sold but 27.3 percent of the aggregate bandwidth sold in the quarter. The average cost per port for these high-end machines has come down very fast, particularly compared to the way the early 100 Gb/sec devices took their sweet time to get affordable. We averaged the port counts at 300 Gb/sec in this category to get the average cost per bit, and ditto for the 25Gb/sec and 50 Gb/sec category and the 2.5 Gb/sec and 5 Gb/sec category. It’s probably not a 50-50 distribution, we realize, but we wanted to get a general sense of where the bandwidths pile up and the costs per bit lay out.
For every speed and generation, the cost of a port and therefore the cost per bit coming out of and going into the ports comes down over time, and while there are some wiggles here and there, these curves are fairly smooth, as you can see:
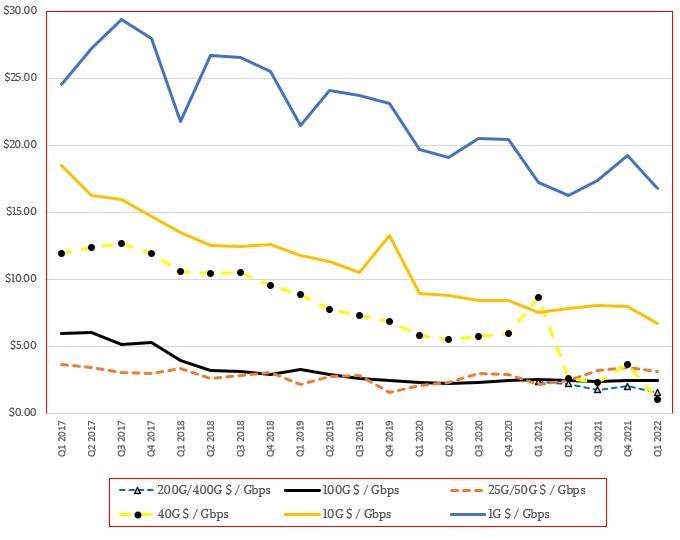
It is not clear to us why the 1 Gb/sec switching market has such a regular pulse and not a relatively smooth line, but there it is. Older 10 Gb/sec and 40 Gb/sec technologies have their blips based on supply and demand, but generally slide down and to the right. The curves for faster devices start lower on the cost per bit scale and run flatter by comparison, but it is still down and to the right, and in the case of the fastest 200 Gb/sec and 400 Gb/sec machinery, you can expect to see new lows in this regard. It is already happening, and you can thank the hyperscalers and the cloud builders and their massive appetites for bandwidth for that.
It will be amazing to see what 800 Gb/sec and 1.6 Tb/sec devices will cost on a per-bit basis once they have been in the field for a year or two.
We are always looking to see who is making all of this money, and IDC supplies this summary bar chart every quarter that shows the vendor trends over time:
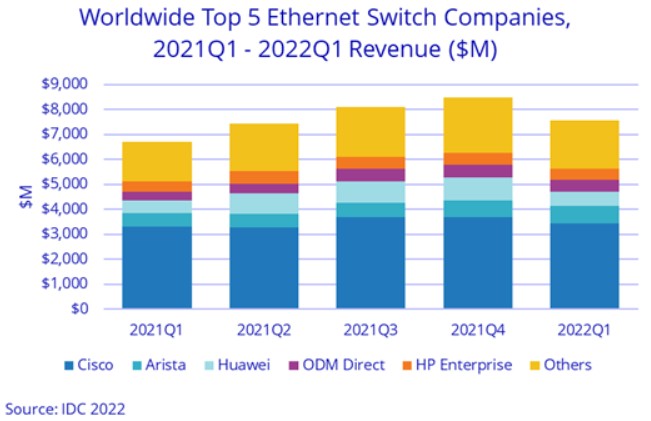
Cisco Systems still has dominant market share in switching, but its dominance is nothing like what it used to be – that is for sure. We build this chart because a line chart is a bit easier on the eyes, and the data goes back further so you can see the rise of the competition:
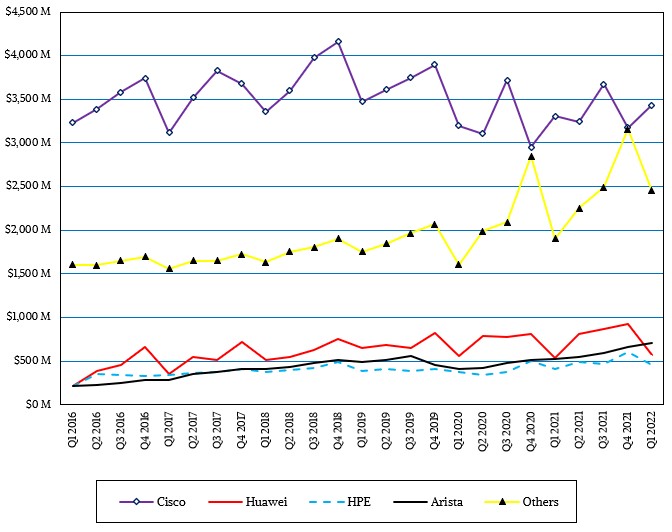
Included in the Others category in our chart is Chinese system and switch maker H3C, which IDC has started breaking out and which is Hewlett Packard Enterprise’s server partner in the Middle Kingdom. We will add H3C to our chart when we have more data. In the meantime, we can tell you that in the first quarter, H3C’s switch revenues rose by 25.3 percent and gave the company a 5.6 percent share of the Ethernet switching market, which worked out to about $427 million.
In recent quarters. IDC has given stats on datacenter versus non-datacenter portions of the Ethernet switching market. The non-datacenter part, which is mostly campus switching at this point with some edge stuff, sales were $4.09 billion, up 6.4 percent. with port counts up 4.7 percent sequentially to 157.9 million. In the datacenter, the ports are faster and a lot more expensive, but there are a lot fewer ports sold, too. In the first quarter of 2022, there were 23.4 million ports sold, about the same as the trailing six quarters, and revenues and up 3.7 percent year on year. Datacenter switching revenues rose by 20.8 percent to $3.53 billion.


This Switcheroo Doesn’t Get Old
Any company that holds more than a quarter of a market – by money or shipments – is doing pretty well. Those few that have somewhere between a third and half of the market are exceptional. Those that attain 65 percent are rare indeed. And those that have 85 percent …
Spectrum-4 Ethernet Leaps To 800G With Nvidia Circuits
When Nvidia announced a deal to buy Mellanox Technologies for $6.9 billion in March 2019, everyone spent a lot of time thinking about the synergies between the two companies and how networking was going to become an increasingly important part of the distributed systems that run HPC and AI workloads. …
The 400 Gb/sec Ethernet Upgrade Cycle Finally Begins
It has been a long time coming. Over two years, in fact. But the hyperscalers and cloud builders, and probably some of the backbones of telcos and other service providers, are finally getting prepared to make the jump to 400 Gb/sec Ethernet. Arista Networks, the upstart that made a lot …
very clear and good article easy to understand. Thank you