

Perhaps the most important decision that any company will ever make is how they intend to structure and store the information they will preserve to encapsulate the goods and services they provide to their customers. Everything flows, or gets obstructed, by this decision, and sooner or later, it all comes down to a database of some sort or another because unstructured data is essentially useless.
In the old days when computing was young and datacenters were exotic and called glass houses – as if they were churches of commerce and technology (ok, they were) – data was stored in flat files, which was just rows of text with something – a comma, a tab, whatever – designating the field for the data. You had to read the whole file to find the data, and you had to do it in batch mode like Hadoop still does today with its MapReduce algorithm. A little more than a decade later, relational databases came along and tabular format was hardened a bit and it not only became possible to index data and query it at the row level, but you could take multiple tables and figure out the relationships between them and run queries against those joined tables – and with enough computing power underneath it, do it in real-time. These days, as datasets are expanding faster than Moore’s Law increases in storage devices and speed matters as much as storage, we have a cornucopia of different kinds of databases at our disposal. Time series databases are finding their niches with much excitement, and NoSQL, NewSQL, key-value, document, and graph databases as well as search engines that are in one sense or another databases.
There is a lot going on here, and The Next Platform wants to do a better job keeping track of all of the innovation and competition here.
This week, we are taking a look at TigerGraph, one of the upstart graph database makers that is taking on the incumbent commercial graph database, Neo4j, as well as a slew of open source projects like GraphDB, Titan and its forks JanusGraph and DataStax Enterprise Graph, ArrangoDB, and online services such as Microsoft CosmosDB and Amazon Neptune.
Here is the general lay of the database land, as Gaurav Desphpande, vice president of marketing for TigerGraph, carves it up:
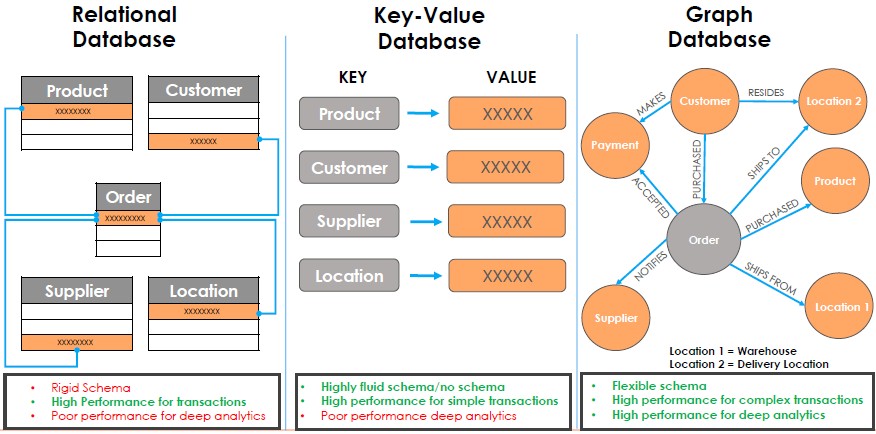
With a graph database, you don’t store data in tables and then skim along the rows and columns to extract answers, input data, or determine relations that drive online transactions, but rather the literal relationships between data are explicitly represented and not figured out interactively on the fly. A graph is a network of things, called nodes, with their relationships expressed as links, called edges. The nodes in a graph database can be tagged with properties, which are additional information that can be used to express more complex relationships and linkages. Relational databases are pretty good at juggling multiple tables that have a few relationships, but as you add more relationships, there is more juggling and that means you need more time and more temporary storage in the system running the database. With a graph database, more complex the queries just mean walking through more edges, which takes more time and more resources, to be sure, but it is a lot less. And, you can actually get an answer – sometimes, when relational databases are juggling and struggling, they just timeout and never get you the answer.
With relational databases, when we think about capacity and performance, we talk about how many rows or columns the database can handle and how fast it can scale a massive table or how many online transactions – customer orders, inventory lookups, and ad hoc queries using the SQL programming language, for instance – the database can perform in a second, a minute, or an hour. For graph databases, you count the maximum number of entities that are expressed as nodes and the maximum number of relationships between those nodes expressed as edges. It is also important to count how many hops deep a graph query can walk across through the network of relationships before it starts slowing down or running out of gas, and equally importantly, you need to know if the graph database can scale across multiple nodes without the latency getting too high. Just like with other kinds of databases, the rate at which data can be injected into the database is also important; load times can be so long that the system is constantly being updated or is constantly out of date.
As Desphpande sees it, there have been three waves of graph databases, with ever-growing functionality, and TigerGraph is not bashful about the fact that its eponymous graph database is out there on the cutting edge:
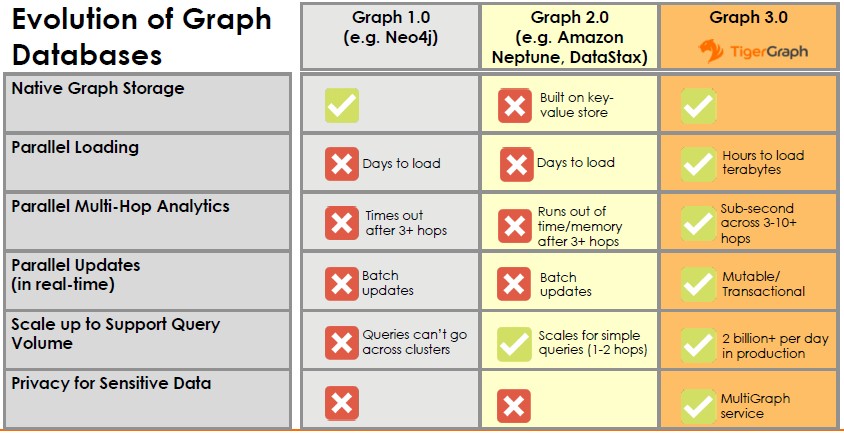
When Neo4j, which is the granddaddy of the graph databases and which is still the most popular one out there on the market today, came out in 2007 and the 1.0 release came out in 2010 demarking enterprise-grade reliability and support, the size of the database that was being deployed as a graph was on the order of 200 GB or maybe as much as 500 GB. The scale has changed considerably, and now a large dataset is on the order of 10 TB. That may not sound like a lot, until you have to buy the memory for a single node and chew against it. At hyperscalers, the graphs are a lot larger than this, and many web-based companies need graph databases and they are looking for something else as they run up against the limits of existing graph databases, much as they created or curated an explosion of datastores and databases when the open source MySQL database that most of them used could not keep up with their data storage and processing demands.
TigerGraph wants to be the graph database that companies choose when they are running up against scalability limits, and it will find itself in direct competition with the JanusGraph fork of Titan, which is backed by Google and IBM, and the DataStax fork as well. Neo4j is not going to sit still, either.
Yu Xu, who is the founder and chief executive officer at TigerGraph, spent some time at IBM as a staff software engineer before joining Teradata as its Hadoop architect in 2006, and after five years of seeing how graph problems didn’t scale on the Teradata platform, Xu took a post as data analytics engineer at Twitter, spending two years helping to build a custom distributed social graph analytics platform for the chirper. After that experience, Xu decided to strike out and build a new graph database, which was done with the help of a dozen customers who started using the product even before TigerGraph came out of stealth mode in September 2017. TigerGraph counts Visa, Uber, Zillow, China Mobile, China Merchants Bank, and Alibaba as its marquee customers, and has raised $33 million in funding since coming out of stealth. (Xu raised the money after the product was done and being tested, not before.)
While GraphDB and Neo4j were built in Java, Xu went down closer to the hardware by writing TigerGraph in C++ and created a custom SQL-like query language called GSQL to tickle the graph database. One of the important distinctions between TigerGraph and other graph databases is that TigerGraph has been created from the ground up to be a distributed platform, spanning multiple nodes. TigerGraph uses an ID hash-based mapping scheme that translates every node ID to a location. The location is split into a machine ID and a memory address location within a machine, and edges are also located right next to their incident nodes. The secret sauce for the distributed platform is that processing is very fast inside a given node and queries are optimized very tightly and data is compressed so only small packets are sent over the networks to run queries against graphs that span more than one node.
The upshot is that rather than having to buy one big wonking server to run a graph database, TigerGraph can use commodity X86 servers (running Linux only) with modest memory footprints (128 GB is enough) and create a very large graph database.
At the Alipay payments unit of Chinese retailer Alibaba, a 20 node cluster (different meaning of the word node, there) has 120 billion nodes and over 1 trillion relationships between the nodes to do fraud detection and check for money laundering; this graph has 2 billion updates each day and was running at 250,000 transactions per second on Singles Day, which is held on November 11 each year by Alibaba, for its 100 million daily active users.
China Mobile uses TigerGraph to monitor the activity of its 600 million cell phone users, looking for fraud, which is obvious when you map out the relationships between callers. Take a look at this picture, which tells it all:

Basically, if the phone logs do not reflect a rich and complex social graph of their users, then you can pretty easily spot the phone that is making spam calls. The trick is doing this kind of analysis across 600 million users.
Desphpande says that there is no inherent limit to the scalability of TigerGraph, but that is not the issue. The number of hops in the query as it runs across the graph is often more important for the kinds of analysis that companies are doing, and TigerGraph can handle up to ten hops, compared to around three hops for the competition.
A graph database needs other things to be suitable for enterprise use and therefore to be worth paying some money to acquire. (TigerGraph is not open source, but it could switch to an open core-enterprise add-on distribution model at some point in the future to drive adoption.) In addition to the GSQL query language, TigerGraph has a visual software development kit called GraphStudio to make it easier to tickle the graph. Security provisions embedded in the database include encryption for both data at rest and in transit, and access control to the data through a feature called MultiGraph, which restricts access based on user, role, or organization.
With the TigerGraph 2.2 release that came out this week, the company is wrapping up the database in Docker containers and integrating with the Kubernetes container orchestrator to make it easy to deploy and maintain both on-premises and in the public clouds. The software now has a one-click install on Amazon Web Services and Microsoft Azure, and has integration points with AWS S3 object storage, Kafka streaming, Hadoop batch analytics and Spark in-memory analytics. Connectors are now available as open source, too, on GitHub.
TigerGraph has done benchmarks on its own graph database compared to alternatives, which you can download here. The company performed tests on the Graph500 synthetic Kronecker graph and the loading of the Twitter user-follower directed graph, and ran itself against Neo4j, Amazon Neptune, JanusGraph, and ArangoDB set up on an r4.8xlarge images on AWS with 32 virtual CPUs, 244 GB of memory, 25,600 provisioned I/O operations per second, and 7 Gb/sec of bandwidth into the virtual servers. The Amazon Neptune service was run on the two largest instances, the db.r4.4xlarge and db.r4.8xlarge instances, which had a lot more IOPS provisioned. In addition to these tests, which were run against TigerGraph 2.1.4, the company issued preliminary results using TigerGraph 2.2 for two-hop queries against the Graph500 and Twitter benchmarks, which is shown below:
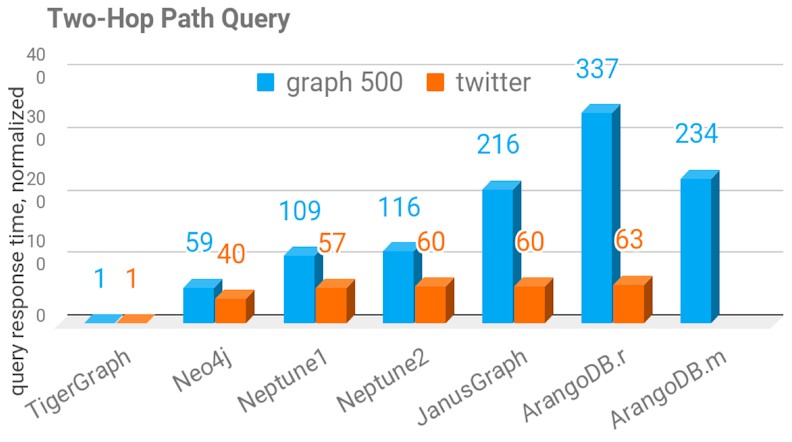
The benchmark tests did not do three hop or deeper queries against the graphs because the other graph databases either timed out or ran out of memory running three hop queries. The chart above shows the relative time to complete queries compared to TigerGraph, not the absolute performance metrics that we think should be presented.
In this chart, TigerGraph is compared to the other graph databases on how much the storage space the dataset consumes compared to the raw data set:
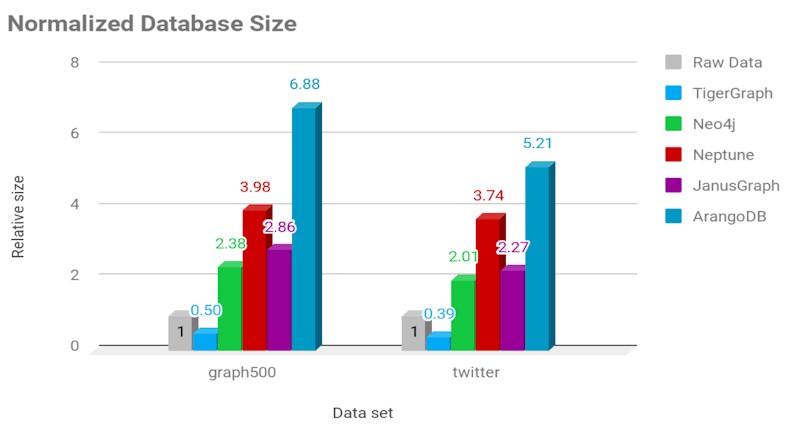 As you can see, the TigerGraph database consumes less space than the raw dataset, thanks to compression techniques, while the others balloon up by anywhere form a factor of 5X to 10X. For loading times, which did not have a chart, TigerGraph was anywhere from 1.8X to 58X faster on single node machines, with Neo4j being the second fastest and with Amazon Neptune being the slowest.
Here is perhaps a more important chart, from its earlier benchmarks, that shows how performance, in terms of query response time, scales with the number of nodes:
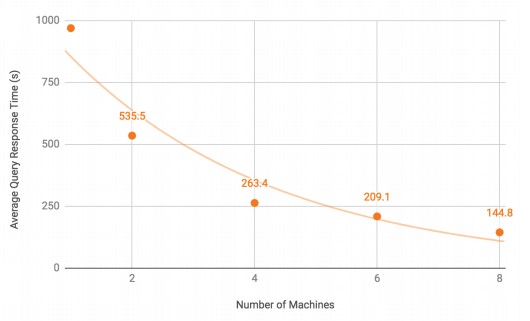
This particular test ran the PageRank algorithm, used for ranking collections of web pages, against the Twitter dataset. The point is, customers using TigerGraph can scale up their clusters to handle larger graphs or to boost the performance in terms of query response time of their existing graphs. This is how distributed computing is supposed to work.
The cost of TigerGraph is dependent not on the performance or number of cores or sockets, but on the size of the data put into the graph database. That price for an annual subscription is tens of thousands of dollars for graphs that are 50 GB to 100 GB in size and comes close to a million bucks for those kissing 1 TB.


Would be great if they could provide perf numbers against Microsoft CosmosDB, which also claim to be Distributed by Design.
“That price for an annual subscription is tens of thousands of dollars for graphs that are 50 GB to 100 GB in size and comes close to a million bucks for those kissing 1 TB.”
Ugh. That’s some SERIOUSLY expensive storage. However, the TigerGraph website fails to mention pricing at all, which is a trend that is fading away. Upfront pricing models that are clear with calculators + quota warnings is what we expect in our cloud services these days. I feel TigerGraph has a ways to go around their pricing model before it feels safe for growing company to lock into their platform.
Ontotext GraphDB is not open-source. But it has a free edition and is worth having a look at it for a range of features one cannot find in PG based engines. E.g. standard compliant query language. Having a schema language (RDFS, OWL, SHACL) is a must for those who want to manage master data and metadata, rather than search paths in graphs. And and a long list of fancy stuff: vector-based similarity, federation across databases, node importance based on PageRank, good integration with Lucene, SOLR and Elasticsearch
No mention of OrientDB? OrientDB is a multi-model database, open-source, backed by company SAP, a decent community, ACID compliant, supports transactions, multi-master, etc. Please update to include OrientDB in your analysis.