
Any processor that hopes to displace the Xeon as the engine of choice for general purpose compute has to do one of two things, and we would argue both: It has to be a relatively seamless replacement for a Xeon processor inside of existing systems, much as the Opteron was back in the early 2000s, and it has to offer compelling advantages that yield better performance per dollar per watt per unit of space in a rack.
The “Vulcan” ThunderX2 chips, at least based on the initial information that is available in the wake of their launch, appear to do that.
Different customers look at components of that performance per dollar per watt per unit of rack space differently, but all four are always a part of the equation even if one of them is zeroed out because money is no object (think high frequency trading) or space and therefore compute density is not a concern (a rural enterprise datacenter close to a major metropolitan area does not have the same pressure as a hyperscaler) or screaming performance is not required (and hence the fact that Intel sells so many middle bin parts to millions of companies each year).
For this reason, it is probably also a good sign that Cavium has cooked up over 40 different SKUs of the Vulcan chips for its initial launch, and stands in stark contrast with the Qualcomm Centriq 2400 line, which had a mere four SKUs at launch last fall and which may be in the process of being shut down or sold off by the world’s second largest maker of smartphone chips after Samsung Electronics.
Incidentally, both Samsung and Qualcomm had an urge, like so many others, to tap into datacenter profits with Arm server chips; Samsung never got off the drawing board before quitting, and Qualcomm has spent four years at it thus far. Broadcom shuttered the Vulcan Arm server chip project and sold it off to Cavium, which has revamped it as one of two distinct ThunderX2 chips. Calxeda, the original Arm server upstart, went bust trying to make the jump from 32 bits to 64 bits in servers, AMD has gone cold on its “K12” Arm chip, and Applied Micro was sold twice and is trying to re-emerge with the “Skylark” X-Gene 3 chip under a new company called Ampere.
“I Have The Phaser, Captain, And I Do Not Intend To Simply Disappear As So Many Of Your Opponents Have In The Past”
Cavium looks to be a survivor in this brutal battle of datacenter compute, particularly in the hyperscale, public cloud, and HPC markets that it is initially targeting with the Vulcan variants of ThunderX2.
We did an initial analysis of these 32 core Vulcan ThunderX2 chips here, and drilled into the original homegrown 54 core ThunderX2 chips (code-name unknown) there. And last week, concurrent with the general availability of the Vulcans, we did a deeper dive into their architecture and promised to get into the latest performance specs provided by Cavium for the Vulcans.
Back when Cavium put out its initial benchmarks for the Vulcan ThunderX2 chips, the results were for single socket machines. With the general availability of the chips, Cavium has tested workhorse two socket machines on compute and memory bandwidth tests, as before, and also has run a few HPC tests and shared results from the University of Bristol, which is one of the champions of Arm in HPC and which put out numbers showing how the Vulcans can compete with Intel Skylake Xeons in the HPC realm. Last time, these benchmarks were done on single socket machines, and the Isambard Project has now completed tests on dual socket machines and graciously shared the results with Cavium to help it make a case for the Vulcans.
Since memory bandwidth is so critical to certain workloads, we will start there, with the STREAM Triad test, which is the touchstone for gauging the relative memory bandwidth of systems. Here is how Cavium stacked up a pair of its top bin 32 core Vulcans running at 2.5 GHz against a pair of Skylake Xeon EP-8176 Platinum processors, which have 28 cores each running at 2.1 GHz and are at the top of the bin for the SKUs with balanced energy efficiency. (You can see all of the Skylake SKUs here.) Take a look:
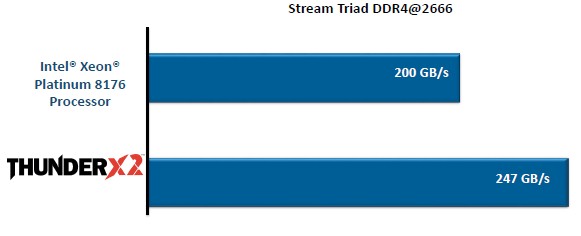
The memory in both systems are running at the highest 2.67 GHz speeds that are available on both machines, and the fact that the Vulcan chip has eight memory controllers compared to the six in the Intel Skylakes is what accounts for the vast amount of the memory bandwidth difference seen between the Xeon ad the ThunderX2. In theory, with 33 percent more DDR4 memory controllers, the ThunderX2 chip should do 33 percent better in terms of memory bandwidth, with the same DIMM capacities and speeds. On the actual test, Cavium is getting a 23.5 percent advantage on bandwidth, and with more tuning it should be able to push that higher. On Intel’s own STREAM Triad tests, which we revealed last summer, a pair of “Broadwell” Xeon E5-2699 v4 processors topped out at about 135 GB/sec on STREAM Triad, and with the top bin Xeon SP-8180M Platinum chips it could still do about 225 GB/sec with the latency held at around 130 nanoseconds on memory access times. So Intel can tune up STREAM Triad a bit better than Cavium can on the Xeons, which is not surprising. The two socket results are consistent with the single socket results, by the way.
For the SPEC integer and floating point compute tests on dual socket machines, Cavium compared the performance of a pair of its more standard 2.2 GHz 32 core ThunderX2 chip to a pair of Intel’s Skylake Xeon SP-6140 Gold chips, which have 20 cores each running at 2.5 GHz and only 27.5 MB of cache on the die activated. (Cavium is quoting internal benchmarks it has run but not yet submitted to SPEC against Intel results that have been submitted, which is not exactly kosher but we have to get the data we can get.) These are both volume SKUs, not top bin (and therefore not very expensive, relatively speaking) parts. The Xeon chip is rated at 150 watts but that does not include the southbridge chipset for linking out to I/O, while the ThunderX2 chip is rated at 180 watts and includes all I/O controllers embedded. In the past, Cavium has shown relative performance on the SPEC tests, but this time, it is showing absolute numbers:
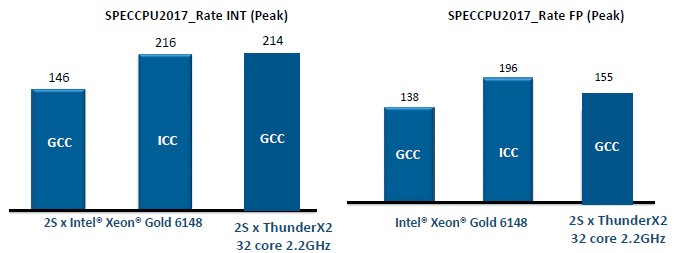
As you can see, Cavium has done a lot of work in tuning up the GNU open source compilers (GCC) to run well on ThunderX2 chips, and in this case is getting nearly the same performance as Intel gets using its own compilers on its own Xeon chips in the integer test. The GNU compilers are not as well tuned on the Intel chips, but they are often preferred by hyperscale and cloud customers and more than a few HPC centers.
As for floating point math, the custom Armv8 cores in the Vulcan chips have a pair of 128-bit NEON math units, and the Xeon SP Gold chips have a 512-bit AVX-512 unit with two fused multiply add (FMA) units activated. (Some of the Skylake chips only have one FMA turned on.) On the SPEC floating point test, the ThunderX2 can beat the Intel chips using GCC compilers, but Intel pulls ahead on its own iron using its own compilers by about 26.5 percent over the ThunderX2 using GCC compilers. The important thing is that Cavium is working with Arm Holdings, which now owns software tools maker Allinea, to create optimized compilers that goose the performance of integer and floating point jobs by around 15 percent, which will put ThunderX2 ahead on integer performance (for these parts anyway) and close the gap considerably on floating point (with about a 10 percent gap still to the advantage of Intel).
Intel charges $3,072 each for that Xeon SP-6148 processor when they are bought in 1,000-unit trays, and Cavium is charging $1,795 for that 32 core, 2.2 GHz Vulcan. If you assume that Cavium and Arm Holdings can get that 15 percent performance boost from optimized compilers – a big if we realize – and assume the Intel compilers are used on the Intel chips, then the ThunderX2 as tested will cost $14.59 per SPEC rating unit across two processors on the integer test, compared to $28.44 per unit for the pair of Xeon SP-6148s. That is a big gap. And while Intel has the performance advantage on the SPEC floating point test, Cavium has the price/performance advantage on these two chips, costing $20.14 per unit of floating point performance compared to $31.35 per unit for the pair of Intel Xeon SPs. The difference of $2,500 per system is a big deal, particularly at stingy hyperscale and HPC shops.
For a more commercial workload, Cavium chose the SPEC JBB Java middleware and database benchmark test, and the higher core and thread count and the higher memory bandwidth – and the better balance between the two – really showed through and gave the Vulcans a significant advantage over the two-socket Xeon-SPs.
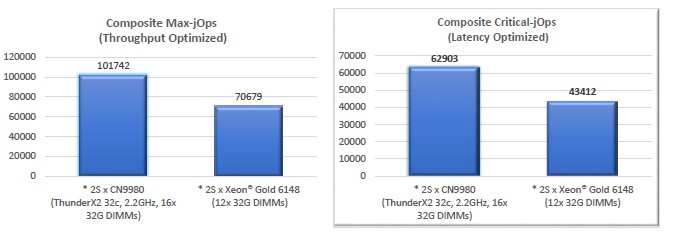
Once again, Cavium is looking at volume SKU comparisons as above. A few notes here on these comparisons. First, there are two ways to run the SPECjBB benchmark: one where you focus on boosting the number of transactions pushed through the system, and another where you pay attention to the latency and try to minimize big tails. Intel has published results for the Xeon SP-8180M Platinum chip on these tests, but has not done so for the Xeon SP-6148, so Cavium had to estimate the performance of this volume part from that of the top bin part. (If Cavium didn’t do it, we would have to or you would have to.) Finally, these are lab results on the ThunderX2 system that have not yet been approved by the SPEC people. Take this all with grains of salt, of course. The ThunderX2 machine has a 30.5 percent or 30.9 percent performance advantage, either way the test was run and estimates done, and the ThunderX2 does a unit of work for about 40.5 percent of the cost (at the raw CPU level) of a Xeon SP.
“In Every Revolution, There Is One Man With A Vision”
Because Hewlett Packard Enterprise is pushing the ThunderX2 in its Apollo 70 supercomputer nodes, the company has run the very tough High Performance Conjugate Gradients (HPCG) benchmark on both Xeon and ThunderX2 nodes, and Gopal Hegde, vice president and general manager of the datacenter processor group at Cavium, shared the results of HPE’s tests with The Next Platform. Using the GCC 7.2 compilers on the volume bin ThunderX2, a two-socket node achieved a rating of 35 gigaflops, compared to 36 gigaflops for the pair of Xeon SP-6148s. That is called spitting distance, and the price difference means the Vulcan chips are doing the work at a 60 percent better bang for the buck.
Finally, there are some new results coming out of the Isambard Project at the University of Bristol. Back in November last year, the Isambard team shared the performance specs on various HPC microbenchmarks on single-socket servers using Broadwell and Skylake Xeons and ThunderX2s. The tests were conducted on 18 core Broadwell, 22 core Skylake, and 32 core ThunderX2 processors. Here is the rematch, doubled up, with everything normalized to the Broadwell performance on the first set of tests:
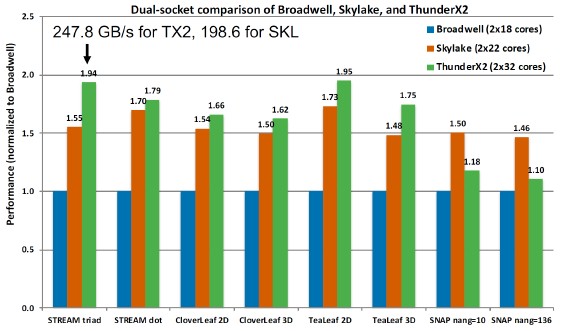
The deltas are about the same as on the single socket machines, and what it really shows is the effect of the NUMA interconnects from either Intel or Cavium when lashing two CPUs together in a shared memory system.
Here is another chart with a series of higher level, full blown applications that the Isambard team has tested on the same iron, the test results that are expected to appear soon in a paper that the Isambard team has yet to publish:
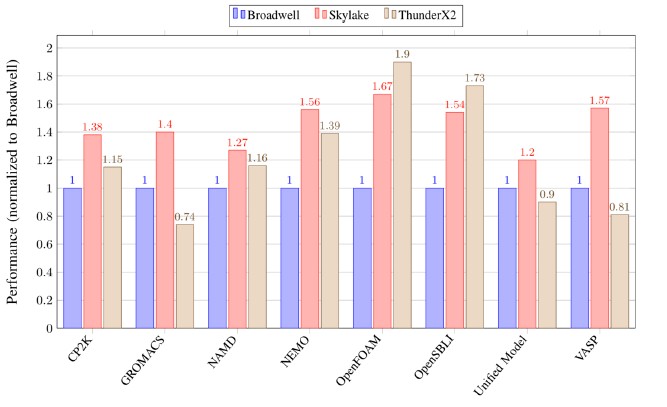
In some cases, the Skylake chips win, in others the ThunderX2 chips win, depending on how the code has been tweaked to the architecture and the nature of the underlying architectures. But the key takeaway here is that ThunderX2, at least on these volume parts, is definitely in the running and will be able to demonstrate about 85 percent of the performance across real HPC workloads at around 42 percent better performance per dollar on average across those eight real HPC applications shown above, and in around the same wattage and in around the same space. If the compilers can be improved through Allinea as expected, the performance gap will close.
This is all significant, and HPC shops and hyperscalers alike should consider it as any wise Vulcan – even one in a parallel universe – would do. And it shows that, as we have been saying all along, that someone will try to come along and make this about price and that any technology that has 50 percent gross margins will generate the very competition that removes that profit. This is how the technology business works.

Intel To Broaden FPGA Lineup And Make Them At Home
Back in 2015, when Intel was flush with cash thanks to a near-monopoly from X86 datacenter compute, it shelled out an incredible $16.7 billion to acquire FPGA maker Altera because a few hyperscalers and cloud builders were monkeying around with offloading whole chunks of CPU compute to FPGAs to create …
The Irony Of AWS Being Intel’s Latest Savior
Intel needs a whole lot of big wins for both its chip design and selling business and its increasingly arm’s length foundry business if it is going to turn itself around and be competitive with AMD and Nvidia on the left hand and with Taiwan Semiconductor Manufacturing Co on its …
Intel Rounds Out “Granite Rapids” Xeon 6 With A Slew Of Chips
It is no secret that chip maker Intel is having a tough time these days on a number of fronts, but it is important to remember that nearly two out of every three processors sold into the datacenter are Intel Inside. This is a good business that can be moderately …
Serve the home reported that in their tests a platform containing pair of thunder X2 was sucking 800W.
So those 180~200W of indicated tdp seem quite far away in practice.
Would be great if you could confirm or invalidate those power numbers.
Was that an at the outlet power measurement of just what the the processors were drawing? And I’d really like to see all the relevant Power9, Epyc, Xeon, and ThunderX2 systems compared to each other with the power draw done at the processor and not from any total system power draw at the wall sorts of metrics. Price/Performance is also a consideration and power usage at the wall can vary according to what peripherals are in use.
Let’s also account for Memory Controller differences as systems with 8 memory channels are going to sip a bit more juice than those with ony 6 memory channels and that includes memory and Memory Slots that are populated with DIMMs.
A ThunderX2 core’s execution resources are still a bit of an undefined sort of entity and that’s not good in a server market that’s more open to the processor makers providing a more complete accounting of just what comprises a maker’s CPU core layout of Decoders, Integer units, Floating point units, Load/store units, Reorder buffers, etc.
There needs to be more testing of the SMT4 capability on ThunderX2 against Power9’s SMT4 variants and even some SMT2 efficiency metrics across the range of competing server makers resepctive designs. So that’s more testing that needs to be done before any rational conclusions can be attempted.
Power Testing needs to be done on the Processor’s power draw with notes indicating the number of memory channels and it’s a well known fact that more memory channels/memory will use more power but there is a definite benefit from having 8 memory channels per socket as opposed to only having 6, so let’s not go down that route just yet until more have had a more thorough go at testing using the scientific method to eleminate any unseen variables.
would it be unreasonable for you to do a follow up article to this comparing AMD Epyc vs Cavium ThunderX2 lineup?
Getting logical about competing at Intel scale –
Review the family of Cavium grade SKUs here:
https://semiaccurate.com/2018/05/14/caviums-thunder-x2-brings-arm-server-up-to-speed/
tNP – “Intel charges $3072 each for that Xeon SP-6148 processor when they are bought in 1000-unit trays, and Cavium is charging $1795 for that 32 core, 2.2 GHz Vulcan”
Cavium 32C Vulcan at $1795 is just under 6148 at 40% off $1843, but there’s more to this . . . .
Xeon Scalable % category volume by grade SKU . . .
Low volume procurement discount key
Deep = < 70%
Medium = 40 to 69%
Shallow = < 39%
In a reservation price system OEM commits to Platinum secures allocation of Gold, Silver/Bronze and W . . . Intel boards and Optane DIMMs to support high velocity Intel sales there are some issues?.
XEON SP PLATINUM
Performance Core; 5.55% of SP volume (shallow discount)
8180, 28C, 2.5 – 3.8 GHz; 1.44% of SP
8168, 24C, 2.7 – 3.7; 1.29% of SP volume
8158, 12C, 3.0 – 3.7; 1.34%
8156, 4C, 3.6 – 3.7; 1.47%
2x DRAM; 4.56%
8180M, 28C, 2.5 – 3.8; 1.29% (medium discount)
8176M, 28C, 2.1 – 3.8; 1.26% (shallow)
8173M, 28C, 2.0 – 3.5; 0.02% (deep discount)
8170M, 26C 2.1 – 3.7; 0.94% (shallow)
8160M, 24C, 2.1 – 3.7; 1.03% (shallow)
Performance/watt;
8176, 28C, 2.1 – 3.8; 1.40% (deep)
8170, 26C, 2.1 – 3.8; 2.31% (medium)
8164, 26C, 2.0 – 3.7; 1.34% (shallow)
8160, 24C, 2.1 – 3.7; 3.87% (deep)
8153, 16C, 2.0 – 2.8; 1.64% (shallow)
8124, 16C, 3.0; 0.002% (deep)
Omnipath; 1.07%
8176F, 28C, 2.1 – 3.8; 0% (deep)
8160F, 24C, 2.1 – 3.7; 1.07% (shallow)
10 year life; 1.10%
8160T, 24C, 2.1 – 3.7; 1.10% (shallow)
1K AWP $7124.19 @
High volume discount 50% to 70% = range $3562 to $2137 low
XEON SP GOLD
Performance Core; 23.27% of SP volume
6154, 18C, 3.0 – 3.7 GHz; 1.77% (s)
6150, 18C, 2.7 – 3.7; 2.13% (s)
6148, 20C, 2.4 – 3.7; 2.82% (s)
6146, 12C, 3.2 – 4.2; 1.47% (s)
6144, 8C, 3.5 – 4.2; 1.69% (s)
6142, 16C, 2.6 – 3.7; 2.95% (d)
6136, 12C, 3.0 – 3.7; 1.96% (s)
6134, 8C, 3.2 – 3.7; 2.10% (s)
6132, 14C, 2.6 – 3.7; 1.96% (s)
6128, 6C, 3.4 – 3.7; 2.03% (s)
5122, 4C, 3.6 – 3.7; 2.31% (s)
2x DRAM; 3.74%
6142M, 16C, 2.6 – 3.7; 1.17% (m)
6140M, 18C, 2.3 – 3.7; 1.19% (m)
6134M, 8C, 3.2 – 3.7; 1.37% (s)
Performance/watt; 16.85%
6152, 22C, 2.1 3.7; 2.38% (s)
6140, 18C, 2.3 – 3.7; 2.09% (s)
6138, 20C, 2.0 – 3.7; 2.27% (s)
6130, 16C, 2.1 – 3.7; 2.64% (s)
5120, 14C, 2.2 – 3.2; 2.54% (s)
5118, 12C, 2.3 – 3.2; 2.78% (s)
5115, 10C, 2.4 – 3.2; 2.09% (s)
Omnipath; 6.04%
6148F, 20C, 2.4 – 3.7; 1.15% (s)
6138F, 20C, 2.0 – 3.7; 1.30% (s)
6130F, 16C, 2.1 – 3.7; 1.13% (s)
6126F, 12C, 2.6 – 3.7; 1.33% (s)
10 year life; 6.11%
6138T, 20C, 2.0 – 3.7; 1.11% (m)
6130T, 16C, 2.1 – 3.7; 1.29% (s)
6126T, 12C, 2.6 – 3.7; 1.27% (s)
5120T, 14C, 2.2 – 3.2; 1.29% (s)
5119T, 14C, 1.9; 1.13% (s)
1K AWP $2555.40 @
High volume discount 30% to 50% = range $1788 to $1277 low
XEON SP SILVER/BRONZE (low volume = shallow discount)
Performance/watt; 18.75%
4116, 12C, 2.1 – 3.0 GHz; 2.51%
4114, 10C, 2.2 – 3.0; 2.06%
4112, 4C, 2.6 – 3.0; 2.70%
4110, 8C, 2.1 – 3.0; 3.60%
4108, 8C, 1.8 – 3.0; 2.34%
3106, 8C, 1.7; 3.06%
3104, 6C, 1.7 – 3.0; 2.46%
10 year life; 2.66%
4116T, 12C, 2.1 – 3.0; 0.84%
4114T, 10C, 2.2 – 3.0; 0.82%
4109T, 8C, 2.0 – 3.0; 0.98%
1K AWP $539.36 @
High volume discount 20% to 40% = range $431 to $323 low
All Performance Core = 28.8% of SP volume
All 2x DRAM = 8.3%
All Performance/watt = 46.2%
All Omnipath = 7.1%
All 10 year life = 9.6%
Xeon SP Full Run by Cores Count
4C = 6.69%
6C = 8.55%
8C = 4.62%
10C = 4.86%
12C = 13.04%
14C = 7.82%
16C = 10.45%
18C = 6.93%
20C = 8.34%
22C = 2.29%
24C = 8.07%
26C = 3.14%
28C = 5.20%
100.00%
% by Minimum Frequency (GHz)
1.6 = 0.00%
1.7 = 5.57%
1.8 = 2.37%
1.9 = 1.14%
2.0 = 8.75%
2.1 = 27.69%
2.2 = 5.95%
2.3 = 6.15%
2.4 = 6.13%
2.5 = 2.76%
2.6 = 11.52%
2.7 = 3.46%
2.8 = 0.00%
2.9 = 0.07%
3.0 = 5.19%
3.1 = 0.00%
3.2 = 5.00%
3.3 = 0.03%
3.4 = 2.06%
3.5 = 1.71%
3.6 = 4.24%
3.7 = 0.07%
3.8 = 0.00%
3.9 = 0.00%
4.0 = 0.14%
100.00%
% within Range by Maximum Frequency (GHz)
1.6
1.7 3.06%
1.8
1.9 1.13%
2.0
2.1
2.2
2.3
2.4
2.5
2.6
2.7
2.8 1.65%
2.9 0.07%
3.0 18.40%
3.1
3.2 8.73%
3.3
3.4
3.5
3.6
3.7 55.37%
3.8 7.73%
3.9 0.42%
4.0
4.1
4.2 3.18%
4.3
4.4
4.5 0.24%
100%
Preferred Bundle; CPU, Intel board, Optane intermediary NVMe DIMM populated as leading taper to make the compliment chase . . .Intel at 30% off compliment $.
High Volume Intel System House Broker Dealer 70% off Intel 1K AWP $946 per CPU
Percent Even Split of XSP SKUs at 7,955,258 units procured.
0.80% W = 60,350 units
22.9% Platinum = 1,821,773
54.9% Gold = 4,367,092
21.4% Silver/Bronze = 1,703,043
On % grade SKU (units) Package GROSS profit if resold @ 70% off Intel 1K = $1,224,687,038 value to the Intel system house also operating as Intel CPU broker dealer.
Under water grades (-$948,762,580) at 70% off Intel 1K won't happen at resale.
Loss leaders too secure Platinum high margin at 70% off 1K.
W (all)
Platinum 8153, 8124 (Price ~ procurement Cost)
Gold 6148, 6144, 6142, 6136, 6134, 6132, 6128, 5122, 6138, 6130, 5120, 5118, 6138F, 6130F, 6138T, 6130T, 6126T, 5120T, 5119T
Silver/Bronze (all)
Logic competing at Intel scale.
Mike Bruzzone, Camp Marketing
amd will spank both this year. amd is dropping a 64 core cpu that will stomp both intel and arm.
Getting logical about competing at Intel scale –
tNP “Intel charges $3072 each for Xeon SP-6148 processor when bought in 1000-unit trays, and Cavium is charging $1795 for 32 core, 2.2 GHz Vulcan” . . . that is just under SP-6148 at 40% off list $1843 . . . but there’s more to this . . .
Xeon Scalable % category volume by grade SKU
Low volume procurement discount key
Deep = < 70%
Medium = 40 to 69%
Shallow = < 39%
XEON SP PLATINUM
Performance Core; 5.55% of SP volume (shallow discount)
8180, 28C, 2.5 – 3.8 GHz; 1.44% of SP
8168, 24C, 2.7 – 3.7; 1.29% of SP volume
8158, 12C, 3.0 – 3.7; 1.34%
8156, 4C, 3.6 – 3.7; 1.47%
2x DRAM; 4.56%
8180M, 28C, 2.5 – 3.8; 1.29% (medium discount)
8176M, 28C, 2.1 – 3.8; 1.26% (shallow)
8173M, 28C, 2.0 – 3.5; 0.02% (deep discount)
8170M, 26C, 2.1 – 3.7; 0.94% (shallow)
8160M, 24C, 2.1 – 3.7; 1.03% (shallow)
Performance/watt;
8176, 28C, 2.1 – 3.8; 1.40% (deep)
8170, 26C, 2.1 – 3.8; 2.31% (medium)
8164, 26C, 2.0 – 3.7; 1.34% (shallow)
8160, 24C, 2.1 – 3.7; 3.87% (deep)
8153, 16C, 2.0 – 2.8; 1.64% (shallow)
8124, 16C, 3.0; 0.002% (deep)
Omnipath; 1.07%
8176F, 28C, 2.1 – 3.8; 0% (deep)
8160F, 24C, 2.1 – 3.7; 1.07% (shallow)
10 year life; 1.10%
8160T, 24C, 2.1 – 3.7; 1.10% (shallow)
1K AWP $7124.19 @
High volume discount 50% to 70% = range $3562 to $2137 low
XEON SP GOLD
Performance Core; 23.27% of SP volume
6154, 18C, 3.0 – 3.7 GHz; 1.77% (s)
6150, 18C, 2.7 – 3.7; 2.13% (s)
6148, 20C, 2.4 – 3.7; 2.82% (s)
6146, 12C, 3.2 – 4.2; 1.47% (s)
6144, 8C, 3.5 – 4.2; 1.69% (s)
6142, 16C, 2.6 – 3.7; 2.95% (d)
6136, 12C, 3.0 – 3.7; 1.96% (s)
6134, 8C, 3.2 – 3.7; 2.10% (s)
6132, 14C, 2.6 – 3.7; 1.96% (s)
6128, 6C, 3.4 – 3.7; 2.03% (s)
5122, 4C, 3.6 – 3.7; 2.31% (s)
2x DRAM; 3.74%
6142M, 16C, 2.6 – 3.7; 1.17% (m)
6140M, 18C, 2.3 – 3.7; 1.19% (m)
6134M, 8C, 3.2 – 3.7; 1.37% (s)
Performance/watt; 16.85%
6152, 22C, 2.1 3.7; 2.38% (s)
6140, 18C, 2.3 – 3.7; 2.09% (s)
6138, 20C, 2.0 – 3.7; 2.27% (s)
6130, 16C, 2.1 – 3.7; 2.64% (s)
5120, 14C, 2.2 – 3.2; 2.54% (s)
5118, 12C, 2.3 – 3.2; 2.78% (s)
5115, 10C, 2.4 – 3.2; 2.09% (s)
Omnipath; 6.04%
6148F, 20C, 2.4 – 3.7; 1.15% (s)
6138F, 20C, 2.0 – 3.7; 1.30% (s)
6130F, 16C, 2.1 – 3.7; 1.13% (s)
6126F, 12C, 2.6 – 3.7; 1.33% (s)
10 year life; 6.11%
6138T, 20C, 2.0 – 3.7; 1.11% (m)
6130T, 16C, 2.1 – 3.7; 1.29% (s)
6126T, 12C, 2.6 – 3.7; 1.27% (s)
5120T, 14C, 2.2 – 3.2; 1.29% (s)
5119T, 14C, 1.9; 1.13% (s)
1K AWP $2555.40 @ High volume discount 30% to 50% = range $1788 to $1277 low
XEON SP SILVER/BRONZE (low volume = shallow discount)
Performance/watt; 18.75%
4116, 12C, 2.1 – 3.0 GHz; 2.51%
4114, 10C, 2.2 – 3.0; 2.06%
4112, 4C, 2.6 – 3.0; 2.70%
4110, 8C, 2.1 – 3.0; 3.60%
4108, 8C, 1.8 – 3.0; 2.34%
3106, 8C, 1.7; 3.06%
3104, 6C, 1.7 – 3.0; 2.46%
10 year life; 2.66%
4116T, 12C, 2.1 – 3.0; 0.84%
4114T, 10C, 2.2 – 3.0; 0.82%
4109T, 8C, 2.0 – 3.0; 0.98%
1K AWP $539.36 @
High volume discount 20% to 40% = range $431 to $323 low
All Performance Core = 28.8% of SP volume
All 2x DRAM = 8.3%
All Performance/watt = 46.2%
All Omnipath = 7.1%
All 10 year life = 9.6%
Xeon SP Full Run by Cores Count
4C = 6.69%
6C = 8.55%
8C = 4.62%
10C = 4.86%
12C = 13.04%
14C = 7.82%
16C = 10.45%
18C = 6.93%
20C = 8.34%
22C = 2.29%
24C = 8.07%
26C = 3.14%
28C = 5.20%
100.00%
% by Minimum Frequency (GHz)
1.6 = 0.00%
1.7 = 5.57%
1.8 = 2.37%
1.9 = 1.14%
2.0 = 8.75%
2.1 = 27.69%
2.2 = 5.95%
2.3 = 6.15%
2.4 = 6.13%
2.5 = 2.76%
2.6 = 11.52%
2.7 = 3.46%
2.8 = 0.00%
2.9 = 0.07%
3.0 = 5.19%
3.1 = 0.00%
3.2 = 5.00%
3.3 = 0.03%
3.4 = 2.06%
3.5 = 1.71%
3.6 = 4.24%
3.7 = 0.07%
3.8 = 0.00%
3.9 = 0.00%
4.0 = 0.14%
100.00%
% within Range by Maximum Frequency (GHz)
1.6
1.7 3.06%
1.8
1.9 1.13%
2.0
2.1
2.2
2.3
2.4
2.5
2.6
2.7
2.8 1.65%
2.9 0.07%
3.0 18.40%
3.1
3.2 8.73%
3.3
3.4
3.5
3.6
3.7 55.37%
3.8 7.73%
3.9 0.42%
4.0
4.1
4.2 3.18%
4.3
4.4
4.5 0.24%
100%
Preferred Bundle; CPU, Intel board, Optane intermediary NVMe DIMM populated as leading taper to make the compliment chase . . . at Intel 30% off compliment price?
CPU only; High Volume Intel Broker Dealer 70% off 1K AWP $946 per CPU . . . which is a commercial price.
Percent Even Split of XSP SKUs at 7,955,258 units procured.
Reservation price system commitment to Platinum secures access to Gold/Silver/Bronze/W and Intel "high velocity sales" kit.
0.80% W = 60,350 units
22.9% Platinum = 1,821,773
54.9% Gold = 4,367,092
21.4% Silver/Bronze = 1,703,043
On % grade SKU (units) Package GROSS profit if resold @ 70% off Intel 1K = $1,224,687,038
value to Intel system house operating as Intel CPU broker dealer.
Under water grades: ( -$948,762,580 ) that will never be resold that way by the system OEM.
Loss leaders too secure Platinum high margin at 70% off 1K.
W (all)
Platinum 8153, 8124 (Price ~ procurement Cost)
Gold 6148, 6144, 6142, 6136, 6134, 6132, 6128, 5122, 6138, 6130, 5120, 5118, 6138F, 6130F, 6138T, 6130T, 6126T, 5120T, 5119T
Silver/Bronze (all)
Logic competing at Intel scale.
Mike Bruzzone, Camp Marketing
Processor architecture is, in the end, a natural monopoly. Not because A makes a better processor than B, but because layer upon layer of software is painfully adapted, tuned, and integrated over an instruction set in order to get useful work done. The cost of integrating that software over multiple foundations, as was done by the 5 leading server vendors in the Unix era in the 1990s, not only drove at least a billion dollars a year of duplicate investment (which added at least $10K to the price of a server), but also forced every customer and every application developer to choose which of the “tribes” to belong to — or choose to maintain parallel integrations over multiple tribes’ gear.
So the PC client industry converged on Windows over x86, and the server industry consolidated on Linux over x86. Not because x86 was “best” in some way (although Intel is staggeringly good at IC process and manufacturing), but simply because it got to scale first and therefore won the natural monopoly.
On the topic of ARM data center processors: the ARM vendors need to find a customer for whom CapEx is important enough, and who has top to bottom ownership of their software stack, to “cross the chasm” at enough scale to fund next gen chips. I can only name two companies which fit that profile (outside of HPC, which is a very real opportunity), and would expect those companies to do ARM (or Power) pilots and bring those numbers to their price negotiations with Intel, and I would expect Intel, knowing the ARM competitors had finite financial runway, to simply discount for those two companies to neutralize the ARM threat. Game theory.
My own view is that Bill Hewlett was right, suggesting that it was unwise to attack a fortified hill, and that perhaps attacking elsewhere might be wiser. Intel has so far remained processor centric. Perhaps there is an opportunity for the ARM vendors to take a lead in the memory centric space — assuming it comes to pass over the next 5 to 7 years — assuming that Intel will concede it in the same way Intel conceded mobile phone processors to ARM. (A memory centric design doesn’t look like a server as we’ve built them for the last 60 years; it looks more like the controller box of an EMC Symmetrix disk array of 20 years ago, with many small processors surrounding a large shared memory/SCM.)
Will be interesting to see how this plays out over the next 20 years.
In the 90’s there were also many operating systems providers, with many variation of unixes. Today, in the server market we have just linux. CentOs, Rhel, Oracle Linux, etc, doesn’t really make a difference.
I personally just recompiled all our software at work on aarch64 architecture, and it was completely transparent. No tweaking, no modification or fixes. The code that compiled in linux for x86_64 just compiled for aarch64.
Your new page layout is very nice. The old layout would not word wrap on my Blackberry Passport phone (best phone ever btw). The new layout wraps nicely!
Why do we compare ThunderX2 with Xeon Gold 6148 but not Platinum 8176?