

Change may be inevitable, but it is also a pain in the neck. And according to the prognosticators at Gartner, who have just released their revised forecast for IT spending for 2024, maybe the IT departments of the world have had their fill of change.
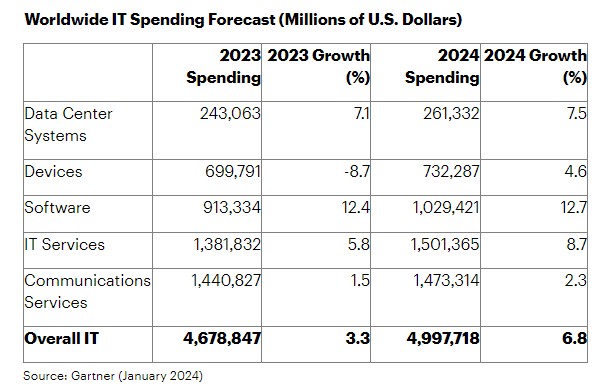
According to Gartner, the growth rate for worldwide IT spending was 3.3 percent in 2023, hitting $4.68 trillion across hardware, software, and services (including telecom and other communications services), and representing only three-tenths of a point acceleration compared to the 2.7 percent growth rate seen in 2022 to $4.53 trillion in spending.
Back in the July 2023 forecast, Gartner estimated that IT spending would rise by 8.8 percent to $5.13 trillion compared to a larger $4.71 trillion estimate for aggregate 2023 spending, and with its January 2024 forecast, it has not only cut its projections for IT growth by 2 points, it has also revised IT spending downwards by $33 billion for last year. So the growth is smaller and so is the base of revenue that it is growing from here in 2024. The latest forecast for IT spending across all areas is for it to be $3 billion shy of $5 trillion, up by 6.8 percent. And frankly, we would not be surprised to see even this growth rate revised downwards in the next Gartner IT spending forecast some months hence give the uncertainties in the economic and political overlays on Earth.
This might seem counterintuitive given the frenzy over AI and for generative AI in particular, but as we have been saying all along, companies are slowing their investments in general purpose infrastructure so they can afford to pay for AI infrastructure. The idea, we think, is that the improved efficiencies that come from adding GenAI functions to applications – meaning the savings in labor costs – will eventually allow for IT budgets to grow more, but enterprises are taking a sane approach to seeing what this new technology is and how it may be used.
But that enthusiastic growth in the overall IT budgets of the world is not happening now, and that, says Gartner, is due to change fatigue possibly warping into change resistance.
“Even with the expected regained momentum in 2024, the broader IT spending environment remains slightly constrained by change fatigue,” Gartner writes in the report accompanying its spending forecast. “Change fatigue could manifest as change resistance – with CIOs hesitating to sign new contracts, commit to long-term initiatives or take on new technology partners. For the new initiatives that do get launched, CIOs require higher levels of risk mitigation and greater certainty of outcomes.”
This is as understandable as it is surprising. We think of IT as eternally optimistic and forward looking, and more importantly, always resilient. Perhaps as it gets ready to celebrate its 60th birthday – marked by the launch of the IBM System/360 mainframe on April 7, 1964 – IT is entering middle age and is more contemplative and less foolish. No one wants the AI equivalent of the Pets.com sock puppet.
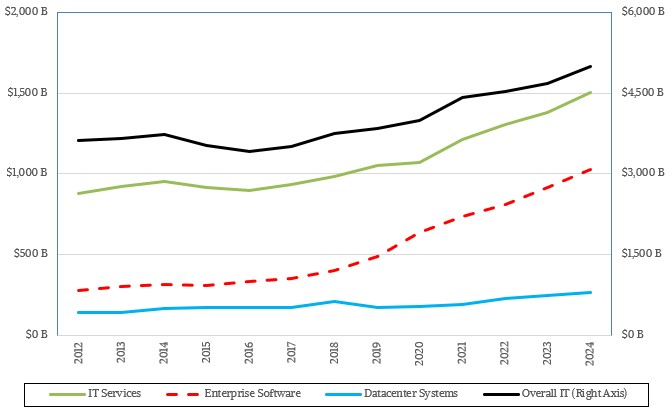
Here is a longer trend chart for data we have compiled over the years from Gartner’s IT spending forecasts. The data for each year represents the last update that was publicly available as the forecasts rolled out a couple of times per year.
And for those of you who love raw data, here is the dataset as we know it. Gartner may have made revisions in the past that we are unaware of, so bear that in mind. But we do not expect the numbers to wiggle that much in the past.
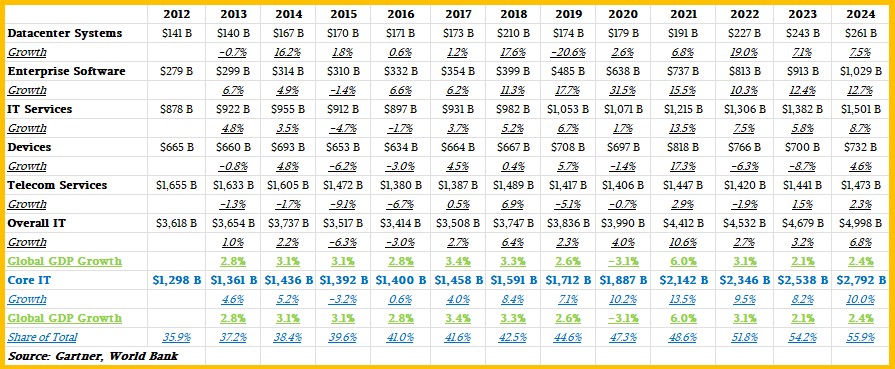
We like to reckon IT spending growth (or decline) against global domestic product growth (or decline) to get a read on how IT is comparing to the overall economic situation. So we added in GDP growth rates and forecasts from the World Bank to our summary table.
We also like to think about the core IT business – datacenter hardware, enterprise software, and IT services – and extract away spending on client devices and various telecom services that are consumed by businesses. So we created a category called Core IT to represent this spending and reckon that against global GDP growth rates.
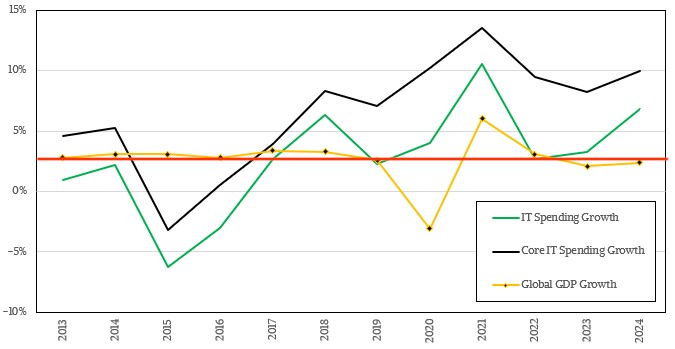
As you can see, with the exception of the GDP growth rate decline in 2020 as the coronavirus pandemic slammed the brakes on the economies of the world and the spike in spending as we started to come out of it, global GDP growth is pretty flat, average just a tad under 3 percent. IT spending is much more variable, but spending growth averages 2.7 percent over the dozen years of growth shown in the table and 1.8 percent over the ten years not including the pandemic anomalies. Given the importance of IT to the global economy, you would think that IT spending growth rates would be higher than GDP, and the fact that they are lower speaks volumes.
Mostly about how devices and telecom services are dominant factors in IT spending. If you look at Core IT spending over those ten years, the average growth rate is 5.4 percent, and it is forecast to be 10 percent in 2024 in the latest Gartner forecast for 2024. That is down from the 12.1 percent growth that Gartner was prognosticating back in July 2023 as it was looking ahead to this year.
The interesting bit for us is that Gartner has revised Datacenter Systems spending to $261 billion for 2024, up from a forecast of $236 billion six months ago, an increase in $26 billion in spending that can probably be attributed mostly to AI clusters for GenAI workloads. Enterprise Software spending in 2024 was cut back by $10 billion to $1.03 trillion, which is just a wiggle waggle in the scheme of things, but IT Services spending for 2024 is now forecast to be a hair over $1.5 trillion, down by $84 billion compared to the July 2023 forecast.
While we are always excited by big numbers, we are also careful about adjusting datasets that span a long time for inflation so we keep a sense of perspective. Here is how the Datacenter Systems spending looks in the raw data compared to the inflation adjustment:
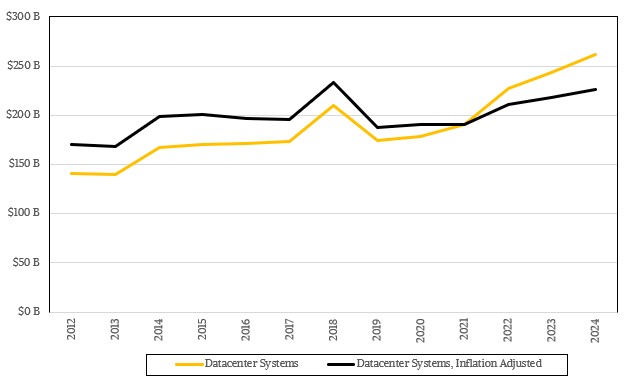
As you can see, taking out the inflation rate, which has been pretty crazy across Earth in recent years, IT spending in 2024 is still well below the peak level of spending set in 2018. If current trends persist, the inflation adjusted spending in 2026 could match that local maxima. We sure wish this dataset went all the way back to 1999 so we could compare it to the Dot-Com boom for some real perspective.
No one has the courage to make a 2025 forecast as yet, at least not publicly. But as soon as Gartner and IDC do so, we will take a gander at them and give you our thoughts.


Inflation Up, Economy Jittery, And IT Spending Consequentially Slows
The increasing cost of goods and services is making everyone a little crazy, and corporate IT departments are not immune from the effects of the dual concerns of rising inflation and the desire by central banks to use interest rates to curb our economic enthusiasm and slow that inflation to …

The Most Volatile IT Spending Year Is In The Rear View Mirror
The future has a nasty habit of being very hard to predict. That uncertainty keeps things interesting and in that sense, we suppose, we should be grateful for it. But sometimes the error bars get a little to big for comfort, and 2020 was certainly one of those years when …

The Interplay Of GDP, Inflation, And IT Spending
Data changes behavior and behavior changes data. It is a phenomenon that is akin to the Observer Effect in physics in that you can’t observe something without changing its behavior. The same is true in economics. If we are constantly worried about a threat of a recession, we will start …
But does Gartner know why IT is taking a breather moving into the first half of 2024? Which is because 2023 was a gang buster year for enterprise procurements. Not new offerings but secondary platform sales. Beyond Epyc volume growth albeit supply limited that is essentially an extension of Brickland multiprocessing in octa core increments, which is an operations known, so said hyper scale and cloud procurements are nothing volume wise compared to legacy procurements and Gartner and IDC don’t cover the secondary sales market.
2023 was a record setter for server sales which require compliment infrastructure, and the system continues to perpetuate a myth around ‘business of compute’ which does not represent primary demand. Subsequently design engineering overlooks what is actually demanded because who wants to talk about legacy and this manipulation is to the point of an economic disablement of industrial potentials. Intel tuned in to this entering 2023 on the volume of sub 28 core Gold and Silver SKUs produced while AMD continues to paint itself into its > 64 core niche bunker.
Gartner and IDC should think twice about the misrepresentations and half-truths they both spread. Just because primary production revenues are up does not mean volumes are up including subject compute infrastructure cost optimization.
Worldwide channel data from June 25th through October 28, 2023 and the sales trend continued into December on use your budget or lose it.
Sapphire Rapids Max = 0.00058% of total available listed here and flat
SR Platinum = 0.113% + 360%
SR Gold = 0.154% + 84%
SR Silver = 0.081% + 115%
SR XW34xx = 0.013% + 109%
SR XW24xx = 0.075% + 12%
Saphire Rapids update, channel available volume increases + 32% from the week of November 4 and if and how fast it will find a home are the key questions?
June 25th through October 28,
Bergamo = 0.027% new entry
Genoa = 0.242% < 14.7%
Sienna = 0.014% new entry
TR5K = 0.078% < 14.4%
q3 to q4 cumulating Bergamo, Genoa, Sienna channel available is now up, as of this week + 77%.
June 25th through October 28 Ice starts selling. Ice that had been sitting, frozen in the channel, begins to clear in the second half of 2023 as the freshest Intel kibble available for the job that must be done keeping business humming along that is not Xeon current generation.
Ice Platinum = 0.274% < 20.9%
Ice Gold = 0.427% < 26.7%
Ice Silver = 0.228% < 25.7%
Ice W = 0.030% + 88.8%
Ice update on December 5 inventory builds,
Ice Platinum at 35.6% of full line now 28.9% on available goes up + 34%
Ice Gold at 45.8% now 51.6% + 85%
Ice Silver at 14,8% now 16.2% + 79.5%
Ice W at 3.6% now 3.1% available up + 42.8%
Full line increase from 11.11 = + 64.3%
Update TODAY, from 11.4 to this week Ice available in the channel is now up + 113%, so Intel and OEMs believe it will sell through and it's not Sapphire Rapids. There is no Emerald Rapids in the channel.
Back to June 25 through October 28,
Milan = 0.658% < 13.5%
TR3K = 0.164% < 5.9%
Copper Platinum = 0.031% + 21%
Cooper Gold = 0.010% + 63.6% comes back and is replaced with what?
Cascade Lake Platinum = 1.275% < 12.9%
XCL Gold = 4.976% < 5.5%
XCLG refresh = 1.461% < 12.9%
XCL Silver = 1.647% < 15.1%
XSL Silver refresh = 0.605% < 14.1%
XCLB all up = 0.536% < 19.6%
XCL W32 = 0.166% < 35.1%
XCL W22 = 0.549% < 25.2%
Rome = 1.527% < 6.4%
TR2K = 0.059% < 7.4%
Skylake Platinum = 2.126% < 32.6%
XSL Gold = 13.18% < 21.2%
XSL Silver + Bronze = 3.739% < 34.4%
XSL W31/21 = 0.640% < 19.9%
E7 v4 8-way = 0.603% < 24.6%
E7 v4 4-way = 0.266% + 21.2%
E5 v4 4-way = 0.810% < 13.1%
E5 v4 2-way = 20.146% < 32.8%
E5 v4 uni = 1.067% < 5.3%
Naples = 0.746% + 9.1%
TR1K = 0.066% + 19.3%
E7 v3 8-way = 0.806% < 8.2%
E7 v3 4-way = 0.166% < 0.08%
E5 v3 4-way = 0.383% < 43.5%
E5 v3 2-way = 28.934% < 24.2%
E5 v3 uni = 1.616% < 7%
E7 v2 8-way = 0.120% < 60.2%
E7 v2 4-way = 0.311% < 21.4%
E7 v2 4-way = 0.034% < 1.8%
E5 v2 4-way = 0.579% < 30.9%
E5 v2 2-way all up = 8.104% < 27.2%
E5 v2 uni = 0.507% < 21.5%
On total volumes of XCL, XSL, v4, v3, v2 resale subject DCG understated production volume totals, 2023 was a block buster server sales year and that is why the first half of 2024 will be slow the appetite for additional compute has been satisfied within the broad market for general compute. Which leaves the business of compute tinker toys for which beyond "New Brickland' there is little to no proof of commercial adoption.
AMD, Intel, Nvidia q/q channel supply results at me Seeking Alpha comment line through the week.
Mike Bruzzone, Camp Marketing