

The future has a nasty habit of being very hard to predict. That uncertainty keeps things interesting and in that sense, we suppose, we should be grateful for it. But sometimes the error bars get a little to big for comfort, and 2020 was certainly one of those years when it comes to global IT spending. But, interestingly and mostly thanks to the way IT systems are integral and foundational to the global economy, despite the coronavirus pandemic and all of the disruption it caused, the overall IT market did pretty well and looks to be on track to recover most of its losses here in 2021.
Back in October 2020, when John-David Lovelock, distinguished research vice president at Gartner, was polishing his crystal ball and peeing into the end of 2020 and out into all of 2021, things were still a bit cloudy – and not in the Amazon Web Services way, either.
“In the 25 years that Gartner has been forecasting IT spending, never has there been a market with this much volatility,” said Lovelock in a statement forecasting spending out through the end of 2021. “While there have been unique stressors imposed on all industries as the ongoing pandemic unfolds, the enterprises that were already more digital going into the crisis are doing better and will continue to thrive going into 2021.”
At that time last fall, Lovelock was projecting that overall IT spending – including datacenter systems, enterprise software, IT services, client devices (both personal and commercial) as well as telecom services used for both business and home would drop by 5.4 percent to $3.609 billion in 2020 and rise by 4 percent to $3.754 trillion. If the whole IT market had just stayed flat from 2019’s $3.816 trillion in IT spending into 2020 and out through 2021, there would have been an incremental $228 billion in IT spending globally. Considering that there is generally some growth in spending each year, the COVID-19 hit, at least at a macro level, is probably smaller. But to put it into perspective, the whole is large enough that all of Dell, all of Hewlett Packard Enterprises, and all of IBM excepting the outsourcing and managed services business it is spinning out would fit into that hole with some room left over. There is no doubt a lot of churn underneath that surface, as usually happens during a recession in IT (whether or not there is a recession in the global economy). The IT waters always look calmer than the undercurrents really are.
In the latest forecast from Gartner, which puts final numbers on 2020 and what is presumably a more accurate forecast for 2021, Lovelock has upped the spending expectations for 2021 as well as locked down 2020. Now, Lovelock says that 2020 IT spending across all categories to dropped by only 3.2 percent to $3.695 trillion and that in 2021, spending will rise by 6.2 percent to $3.923 trillion. That will fill in some of the gap created by COVID-19 in both years.
While certain industries – entertainment, travel, hotel – have been hit incredibly hard in 2020, and will no doubt have trouble until the vast majority of people are vaccinated and we know there is not another novel coronavirus lurking in the shadows, some industries, such as healthcare, construction, and home improvement retailers have done the kind of data processing every day that used to happen on only their best couple of days in the year. This has compelled all kinds of capacity expansion and application and infrastructure modernization efforts. Companies have found the money to do this, and are better off for it – more than a few are five, six, or seven years ahead of schedule on their modernization efforts. And those who did not find the funds to do such upgrades will find themselves that much further behind when the coronavirus pandemic is behind us.
As we have said many times before, recessions don’t cause technology transitions, but they surely do accelerate them.
We are always interested in trends over time as well as raw numbers in any point-in-time forecast, and so we went back into the Gartner archives and pulled together all of the data publicly available since Gartner started presenting worldwide IT spending in this current fashion. Before 2012, the software and hardware was carved up differently, and we wish that the data could be cast all the way back to 2007 so you could see just how dramatic the Great Recession really was compared to the COVID-19 chaos. All things considered, IT spending has held up pretty well and is bouncing back much faster.
In any event, here is the data we can find since 2012 and forecast out to 2022, broken down by category:
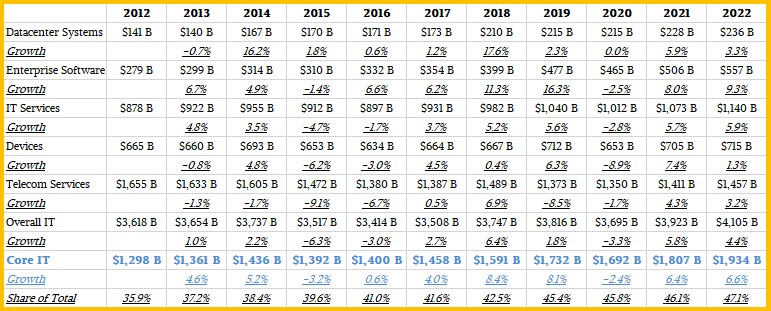
Datacenter systems means servers, storage, and networking spending with all of the overlaps taken out. Enterprise software is the value of the software acquired by organizations around the world to run themselves. This is not software installed on our PCs and smartphones for personal use. IT services run the gamut from application programming and hosting, cloud infrastructure, break fix, systems integration, and so on. This is what we are calling Core IT in the table above, which we want to separate from spending on devices – desktops, laptops, tablets, and smartphones – that are not really in the datacenter and telecom services, which are a different beast entirely.
There is one thing to note right away. Datacenter system spending was flat at $215 billion from 2019 to 2020. Considering everything about 2020, that is nothing short of amazing.
Spending on enterprise software continues to grow, and we will point out another thing. Hardware gets Moore’s Law improvements which help the unit of capacity go down as the demand goes up. Software, at least for a few more years until AI does all of the work, is written by human beings, and they get more expensive per unit of work every year. How much is hard to say. On top of that, for many decades now, more and more functions of a business are being implemented in processes that were done by hand or in person, and there are whole new areas of command, control, analysis, and recommendation that were not even possible a decade or two ago that are now normal and implemented in software. So, generally speaking, we are not surprised as enterprise software revenues go up. So many things push it up, and the Moore’s Law improvements in cost per capacity of hardware allows for software to fill this capacity as it becomes affordable. In any event, in the aggregate, enterprise software spending fell by 2.5 percent in 2020, to just above $465 billion.
IT services are similarly people intensive and subject to the human cost inflation that software is, and this business has steady elements that just hum along for years at a time and transactional elements where organizations are eager to deploy hired guns to fix a particular problem in the near term. The IT services business, in the aggregate, fell by 2.8 percent to $1.012 trillion in 2020, and as you can see from the table above, is expected to get back to a growth rate that is closer to the normal 5 percent to 6 percent.
The Core IT subset of this – our categorization, not Gartner’s – is these three elements added together, and in 2020, that declined by 2.4 percent to $1.692 trillion and is expected to grow by 6.4 percent this year according to Lovelock’s forecast, to $1.807 trillion and to grow another 6.6 percent to $1.934 trillion.
For those of you who like data visually, here is the same data for these three key elements since 2012:

The IT market is a fleet of big ships moving with a lot of momentum, and that is why it is so hard to move the needle up or down by very much year on year. But even with relatively small percent changes, it is an enormous amount of money. Like on the order of the size of social or military programs in developed nations.
This Gartner data, nor similar data from rival IDC, does not easily allow for the IT sector revenues to be carved out of global gross domestic product, but it would be interesting to see how that ratio has changed over time and what share IT products represent of all goods and services sold in a year.


Be the first to comment