

In an ideal world, there is a balance between compute, network, and storage that allows for the CPUs to be fed with data such that they do not waste too much of their processing capacity spinning empty clocks. System architects try to get as close as they can to the ideals, which shift depending on the nature of the compute, the workload itself, and the interconnects across compute elements — which are increasingly hybrid in nature.
We can learn some generalities from the market at large, of course, which show what people do as opposed to what they might do in a more ideal world than the one we all inhabit. We tried to do this in the wake of Ethernet switch and router stats and server stats for the second quarter being released by the box counters at IDC. We covered the server report last week, noting the rise of the single-socket server, and now we turn to the Ethernet market and drill down into the datacenter portion of it that we care about greatly and make some interesting correlations between compute and network.
The data that IDC provides allows spreadsheet monkeys to gain a certain amount of insight into what is going on, provided they are willing to make a few estimates here and there to fill in the gaps. Which we have done on your behalf.
 In the second quarter ended in June, Ethernet switch revenues across all types — datacenter and campus networks are the two main categories, with other home and office use cases thrown into the mix, mostly for 1Gb/sec equipment — rose by 10.8 percent to $7.36 billion. Router revenues, by contrast, fell by 0.5 percent to $3.94 billion, continuing a pattern we have seen since IDC first starting talking publicly about the split between switch and router sales in its quarterly reports back in the third quarter of 2015.
Routers are generally very expensive, and have come under attack by vendors pushing alternate routing software — think Arrcus and DriveNets — that can run on commodity switching iron that is based on merchant silicon, usually from Broadcom, the juggernaut of switch ASIC makers these days. So we expect to see downward pressure on router revenues for the foreseeable future, just like we saw the rise of merchant ASIC vendors and portable operating systems on Ethernet switches in the datacenter starting in the late 2000s. The Ethernet switch data from IDC goes much further back, as you can see. But in general, we think that there will be more and more routing in the datacenter on switch devices, and drawing these lines will be increasingly difficult — just as it was difficult to tell what operating system is running on a server after it is sold and therefore IDC stopped talking about it quite abruptly a few years back. At this point, it is mostly Linux with a lot of Windows Server and not much else.
As you can see from the chart below, the status quo was more or less maintained in the Ethernet switch market in Q2 2021, with Cisco Systems the dominant supplier by far, under a lot of competitive pressure but now only comprising 44.1 percent of the overall Ethernet switch market in the period, with $3.24 billion in sales. Huawei Technologies, which is the dominant networking gear supplier in China, had an 11.1 percent share of the overall Ethernet switch pie and increased revenues by 4.5 percent to $817 million. This is despite sales of its equipment being blocked by several governments around the world.
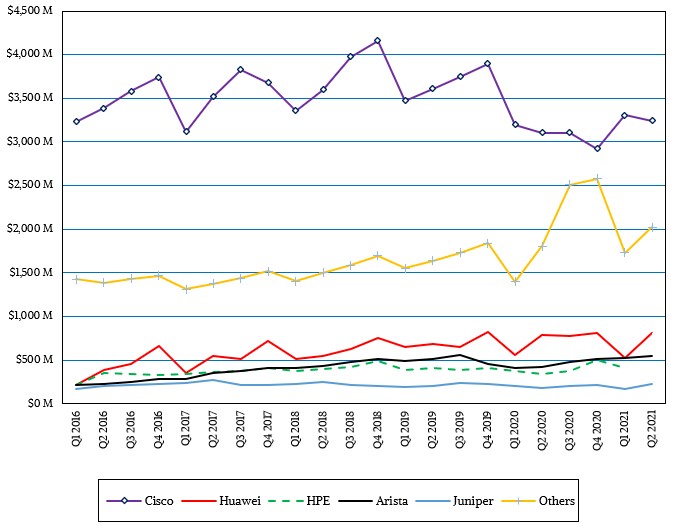
Arista Networks, no longer an upstart, grew Ethernet switch sales by 31.6 percent to $552 million, giving it a 7.5 percent share of the Ethernet pie, and notably Arista Networks has spent the past several years breaking out of the datacenter and into the juicy campus networks market, which it correctly perceived as ripe for some competition. Hewlett Packard Enterprise, on the strength of its Aruba wireless offerings, had a 6.7 percent share of the Ethernet racket and brought in $493 million in the quarter, while Juniper Networks, once the high-flying main rival to Cisco, has 3.1 percent of the market after growing revenues by 23.3 percent to $228 million.
Starting last year, IDC begun splitting datacenter and non-datacenter Ethernet switch revenues and ports into two pairs of buckets, which is interesting indeed. We have the perception sometimes that the datacenter is the big consumer of switches and ports, but that is not so. Here is the quarterly data that we have been able to compile for these two distinct markets thus far:
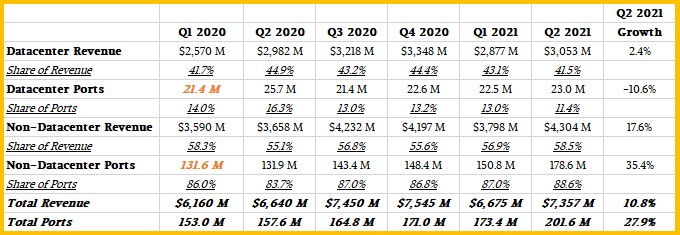
Due to a massive increase in 1Gb/sec switch sales outside of the datacenter, non-datacenter switch sales posted sales of $4.3 billion, up 17.6 percent, against a total of 178.6 million ports sold, up 35.4 percent. The datacenter port count in the quarter was relatively low, at 23 million ports, actually down 10.6 percent, while revenues were up by 2.4 percent to $3.05 billion thanks to the uptake (finally!) of 200Gb/sec and 400Gb/sec Ethernet switches. Datacenters and switch vendors have been waiting a long time for the switch, transceivers, and adapter technologies and costs to align to set up the next wave of price/performance increases in datacenter networking based on Ethernet.
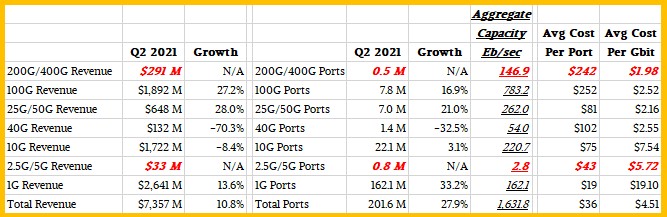
Starting this year, IDC has begin splitting out sales of low-end Ethernet switches that run at 2.5Gb/sec and 5Gb/sec speeds and also is starting to see sales of 200Gb/sec and 400Gb/sec devices. At the moment, the market researcher is saying very little precise about these parts of the market, so we have to make some assumptions about revenues and port counts to avoid throwing the whole model we have built off. These estimates are shown in bold red italics, as usual.
The table below is a bunch of math we did on the derived data from the statements that IDC gave out, which shows the revenue, ports shipped, and aggregate bandwidth of Ethernet switches by downlink port speed on the device. (Our apologies, but we have been labeling the aggregate capacity of the ports shipped by downlink speed Pb/sec — that’s petabits per second — instead of the Eb/sec — that’s exabits per second — that it should have been.) And as we have been doing for years now, we have calculated out the cost per port and the cost per gigabit transferred to allow you to make intelligent observations about the nature of the switch market in the current quarter and over time. Here is the table showing all of this data:
And here is the chart of the data that we have been able to compile over time:
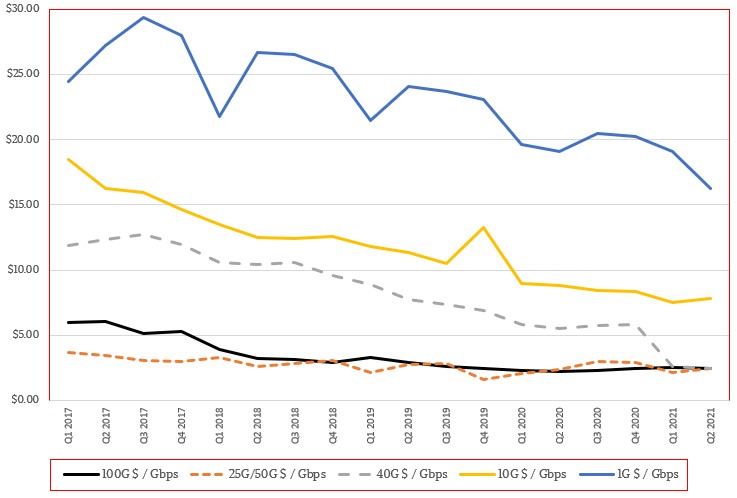
As data for the new switch categories becomes more clear, we will add it.
The point of this chart is that with each technology speed bump in Ethernet switch, the cost per bit transferred and received goes down, and over time, each technology itself gets cheaper and cheaper until it levels out. The 1Gb/sec switch market — which is so 2001 in the datacenter — has a long, long life in the campus, home, and office markets. We suspect that the 2.5Gb/sec and 5Gb/sec products will have a long life outside of the datacenter, and that 10Gb/sec and 25Gb/50Gb/sec products will have a long life within the datacenter.
So now let’s have some fun. First, let’s plot server revenues against switch and router revenues for the period that we have the publicly available information from IDC. Take a look:
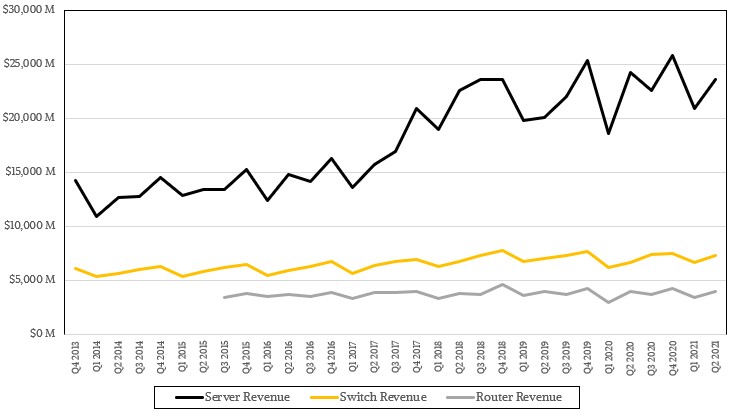
The ratio of server spending to switch spending is typical for what we see in distributed systems at large, and this makes sense when you remember that campus networks have a buttload of print, file, and application servers on them that are not in the datacenter. The campus network is really a distributed collaboration computing system, and network and compute are important here, too.
If we want to get a better read on the datacenter, however, it probably makes sense to figure out how many cores of compute are in the servers and plot that against the number of switch ports. So we spent a little time and did a little black magic estimating the cores installed each quarter and counted up the switch ports with speeds of 10Gb/sec or above. Check it out:
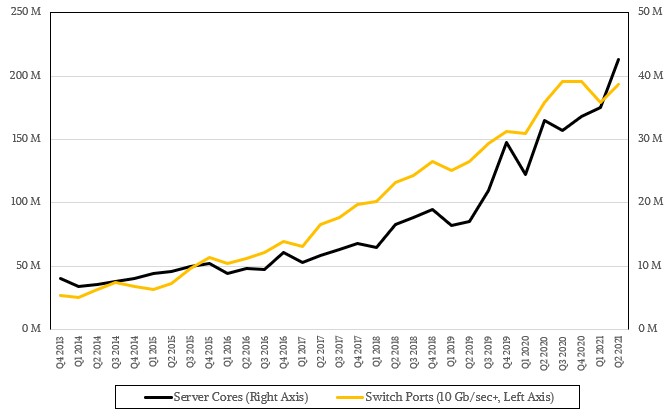
That is a pretty linear relationship, isn’t it? About what we expected, in fact. It would have been interesting to have actual server and switch data for the datacenter by itself, of course, so we could see what the ratios are just in the datacenter.
And for a final bit of fun, we took the aggregate relative performance of servers that we figure out every quarter and plotted it against the aggregate switch bandwidth (in Eb/sec) across the switches sold in the quarter for all switches with 10Gb/sec or greater speeds. And here that is:
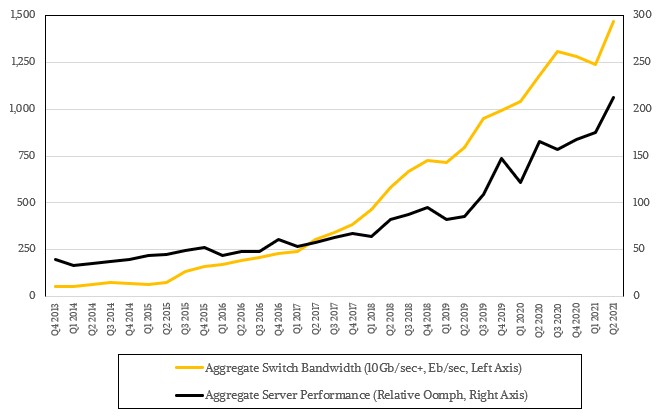
Switch bandwidth is growing slightly faster than server performance, in the aggregates, and that makes a certain amount of sense to us. For many years, we could not get to 100Gb/sec speeds affordably, and the datacenter had to make do with 40Gb/sec speeds and then 25 Gb/sec and 50Gb/sec speeds. But not so today, with 100Gb/sec ports as cheap per bit moved as 10Gb/sec ports, and 200Gb/sec and 400Gb/sec ports coming online at a very reasonable price compared to the very high cost six years ago when the first generation of 100Gb/sec Ethernet switches first hit the market. The switch cadence has picked up the slack and steadied the pace, just like the CPU makers are doing for servers.
This will all be good until we hit the Moore’s Law wall and have to wait for packaging and other enhancements to provide speed, density, and lower costs per unit of capacity for both servers and switches. If we are lucky, the stall will not be long. And if we are really lucky, we won’t feel it at all.


Be the first to comment