

For a market that is so integral to the global economy, it sure is hard to get a complete dataset on quarterly and annual spending on information technology. We try to gather up all of the information we can find and flesh it out where we can so you can see trends and see how what you are buying or what you are selling or what you are investing in pans out as time goes by.
We like feeds and speeds, but we like dollars and sense, too.
The latest datacenter infrastructure spending track from IDC is out for the third quarter of 2023, and its forecast for all of 2023 allow us to take a pretty good stab at figuring out what spending on servers and storage looked like in the final quarter of 2023. (It’s just the addition of three numbers quarterly subtracted from the bigger annual forecast. It’s not rocket science, and we know because we studied rocket science.)
According to the IDC Worldwide Quarterly Enterprise Infrastructure Tracker: Buyer and Cloud Deployment report, spending on storage and servers across hyperscalers, cloud builders, enterprises, and other organizations came to $40.2 billion in the third quarter, which is a decline of 1.5 percent year on year. Service providers of all kinds – which means hyperscalers, cloud builders, telcos, and other kinds of service providers – accounted for 61.7 percent of spending, up 7 percent year on year to $24.9 billion. Spending on servers and storage among enterprises, government agencies, research facilities, and educational institutions fell by 6.3 percent to $15.3 billion and accounted for only 38.3 percent of server and storage spending.
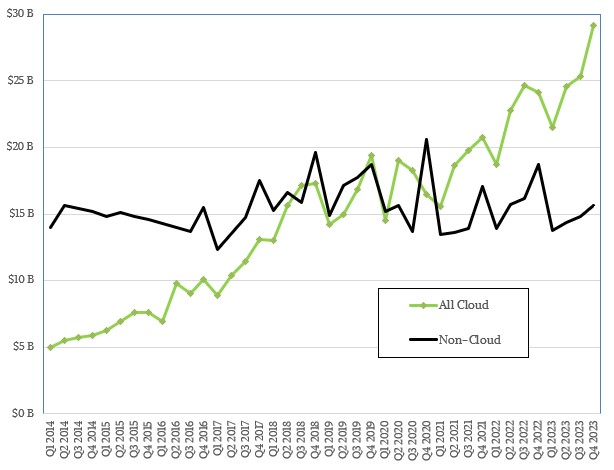
Since 2014, IDC has been cutting the market for servers and storage into infrastructure used in a cloudy fashion – meaning, to support virtualized or containerized workloads – as opposed to the kinds of bare metal work we see done in corporate datacenter to run databases and ERP applications or HPC systems for simulation and modeling. We are not sure where – or how – you draw these lines, but here is the trend data for that over time:
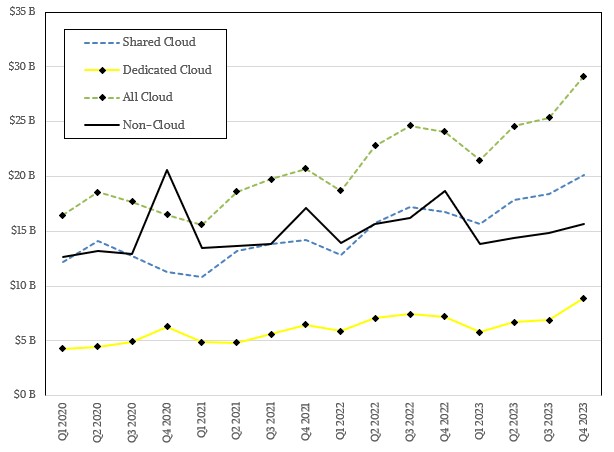
Since 2016, IDC has offered a little more of a sensible breakdown into what this cloud spending is, breaking it into dedicated cloud – by which it means systems that are use to host applications for specific companies either in a co-location facility or in their own datacenters – as opposed to the kind of shared cloud that the big cloud builders, such as Amazon Web Services, Microsoft Azure, Google Cloud, and hundreds of others, put together and rent out hourly or monthly or annually.
The shared cloud figure gives us a sense of what the cloud builders are spending on infrastructure, which is useful, but we don’t know where the hyperscaler portion is attributed. And for pure-play hyperscalers like Meta Platforms, who don’t sell capacity on their massive systems, we are not sure where these are counted in the IDC scheme of things. Our presumption is that hyperscalers are thought of as shared cloud providers who only have a SaaS offering that happens to be free and that is paid for by advertising.
The other interesting breakdown that IDC offers is to split the dedicated cloud spending into two more bits, which is dedicated on premises – which means stuff companies build for their own use or to park into a co-lo facility as well as any dedicated infrastructure they buy from the big clouds such as AWS Outposts, Microsoft Azure Stacks, Google Anthos as well as (we presume) systems bought under HPE GreenLake, Dell Apex, Lenovo TruScale, or similarly utility priced schemes.
What seems obvious from this is that non-cloud, bare metal systems kinda hover at around $15 billion a quarter, and that cloudy infrastructure keeps on growing and is expected to be kissing $30 billion a quarter as 2023 came to an end. (We will see in three months when IDC does the counting for Q4 2023.)
Remember: This shared cloud number is not the spending that end user companies and other organizations spend each quarter to buy capacity on the clouds. This is many times greater, as evidenced in the revenue streams among the big public cloud providers. (We just did a deep analysis of the cloud revenue streams from Amazon, Microsoft, and Google at this link.)
The other thing we really value about this particular IDC dataset is the forecast that the company does over a five year span for the past decade.
Here is what the forecast chart looks like from IDC:
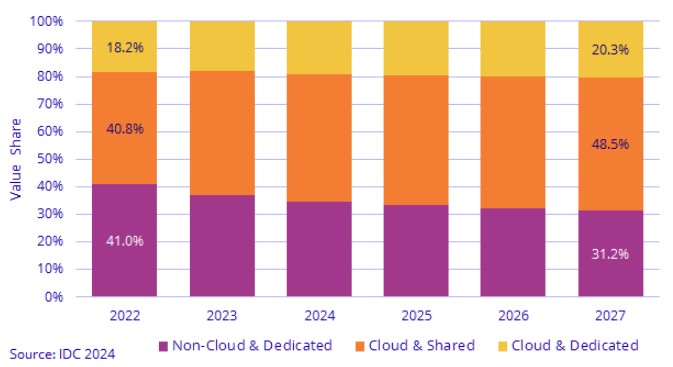
Ok, we get it, the hyperscalers and cloud builders are on an asymptote to 50 percent share of server and storage spending. Beyond that, this chart doesn’t help us see much. Which is why we like raw data, such as we have assembled and calculated upon in this table:
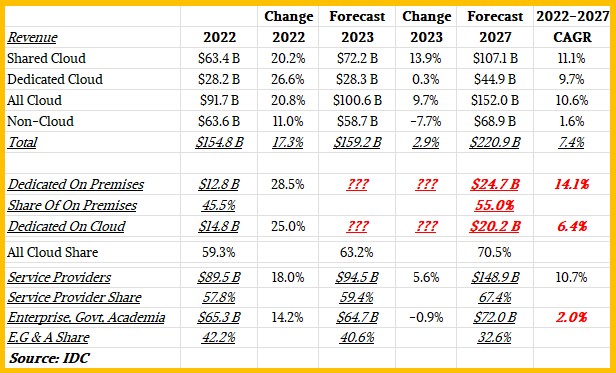
This table above only has data for 2022 and the forecasts for 2023 and 2027, but you can get a better sense of where the market for servers and storage is going from this.
As you can see, IDC expects for the overall market for servers and storage to grow at a compound annual growth rate of 7.4 percent between 2022 and 2027 (inclusive), to reach $220.9 billion. Networking investments are incremental to this, and we have no idea what IDC thinks about that. By the end of this forecast period, cloudy infrastructure – both shared and dedicated – will drive 70.5 percent of server and storage purchases. We took a stab at what share of dedicated cloud infrastructure would be on premises and what share would be on the clouds, and we think the on premises dedicate cloud share is going to rise, not decline, thanks to utility pricing and the desire to keep physical control over infrastructure by enterprises. Make your own guesses. . . . 2027 is still pretty far away.
What jumps out of this forecast for us is that Q4 2023 must have been pretty bad for the non-cloud crowd for sales to drop by 7.7 for the full year to $58.7 billion. If you do the math on the data that IDC provided, overall server and storage spending in Q4 will rise by 4.4 percent to $44.7 billion, but non-cloud will drop by 16.3 percent to $15.7 billion. This decline must be temporary, more or less, for the five year forecast for non-cloud infrastructure spending to rise by 1.6 percent CAGR between 2022 and 2027 to hit $68.9 billion by the end of the forecast.
The real point is that server and storage spending is expected to outpace global gross domestic product growth by maybe a factor of 2.5X, which is what we calculated by poking around the Internet for those stats. And this is perfectly normal, even if we don’t think that ratio will last forever. IT is getting more expensive and more pervasive, that gap will probably stay in that 2.5X range for as long as most of us need to worry about it.
Here is what we would really like to see: Spending data broken out by AI servers and Other servers. This would be quite useful.


Be the first to comment