

If you want to understand datacenter infrastructure and how the market for wares is changing, it helps to start with an absolute, top-down, all-encompassing view that brings together all server, storage, and switching revenues into a single bucket, eliminating the overlaps that occur when talking about these three different categories separately.
This is not an easy thing to do. Is hyperconverged infrastructure compute or storage? Is a server running network function virtualization networking or serving? On and on and on. This is why a couple of years back, the market researchers at IDC who manage the server, networking, and storage segment independently got together and started tracking overall infrastructure sales, adding up all of the server, switching, and storage revenues together each quarter and then separating them back into three different buckets: Public cloud, private cloud, and private non-cloud systems. This way, we can not only see what the public clouds consume separate from the rest of IT, but we can also see how other enterprises are consuming cloudy infrastructure themselves as well as traditional bare metal iron for standalone workloads.
The first surprise to anyone is that there is so much of this traditional non-cloud stuff being sold, and the recent data from IDC, released this week and covering the third quarter of 2020, points that out very clearly. (Most vendors have not reported their fourth quarter results and it takes time to parcel and parse all of their results to break the revenues of core compute, storage, and networking sold into datacenters into these three buckets. We will know how 2020 ended up a few months from now. . . . ) Now, it is important to realize what this data is and what it is not. IDC has always tracked factory revenues at IT suppliers in its market trackers, so this is not the value of sales to end user organizations for private or public infrastructure. Rather it is the revenue generated by suppliers to their channels or their direct customers, and in the case of the big original design manufacturers (ODMs) who custom make iron or those original equipment manufacturers (OEMs) who sometimes have divisions that act like them, to the big hyperscalers and cloud builders directly. This data is not – it is not – the aggregate value of the metered infrastructure that the public clouds collective sell in the world.
This is perhaps a mixing of apples and pears, which are both in the rose family, but this mixing is only a matter of degree. Server makers have always had a mix of channel and direct user sales, and the aggregate revenues are always larger if you take into account the reseller markups. We suspect that the markup for the cloud builders is even higher, but it is hard to get a sense of this given the very high-level financial results they report, if anything. But we similarly never really knew what the millions of end users were paying for servers, switches, and storage, either, except for that portion of direct sales vendors do for their top few thousand accounts that that probably make up maybe 50 percent of their revenues.
We gather data – or pay others to do so – for the trends, not for the absolutes. The deltas are just as valuable as the values, as it were.
This is why we love this dataset that IDC has been building up on IT infrastructure spending for the past six years. The data is only available in summary form each quarter, but we have been watching for a long time and keep track of it and the updates IDC makes for its year-on-year spending estimates each quarter. This is not necessarily exactly the same as the model IDC has inside the company, but it is as good as you can get from the publicly available data that is free. Here are the trend lines for IT infrastructure spending – that’s limited to servers, storage, and Ethernet switching to be precise – since the first quarter of 2014. Take a look:
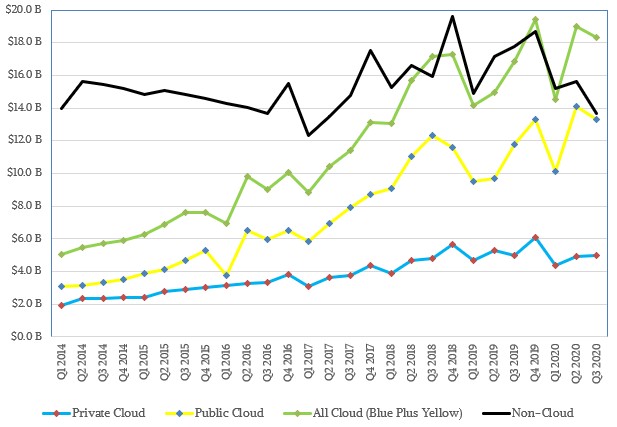
The blue line is on IT equipment that is used to create private clouds. It has been bouncing between $4 billion and $6 billion a quarter for nearly three years, and in the past two quarters, according to IDC, it has been just around $5 billion per quarter. By definition, this is enterprise IT spending, not hyperscaler and public cloud infrastructure, and by definition, what is characterized as public cloud also includes what should be called private cloud spending by the hyperscalers because not all of their infrastructure is rented to customers on an hourly or a minutely basis; some of it is used to support free or paid services (think search engines or ad serving engines) and some is used for internal systems (think fraud detection and machine learning recommendation engines) to support various applications. Like I said, there is some fuzziness in this data. Anyway, the yellow line is the capacity bought by public cloud builders and hyperscalers, and this has been larger and trending faster than the private cloud infrastructure spending since IDC started tracking this. The average in the past two years has been around $12 billion a quarter, but the amplitude spikes are pretty big as you can see.
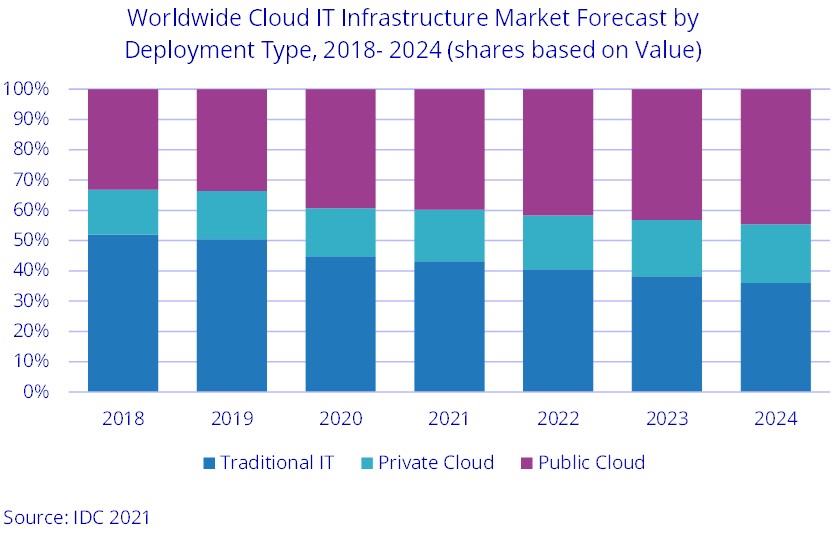
Add the blue line and the yellow line together and you get all cloud infrastructure, which is on average running at about the same pace as non-cloud infrastructure. (Getting these numbers must involve pinning portions of networks and block of storage to specific kinds of systems, obviously.) Over the long haul, as we have been saying since the utility computing idea, which predates the launch of Amazon Web services by seven years at least, all computing is cloud and this chart is just a way to plot this out. And we are going to consider bare metal servers running Kubernetes containers as cloud, and we are frankly not sure how IDC might count that. But IDC agrees that this transition is unavoidable, and here is its forecast:
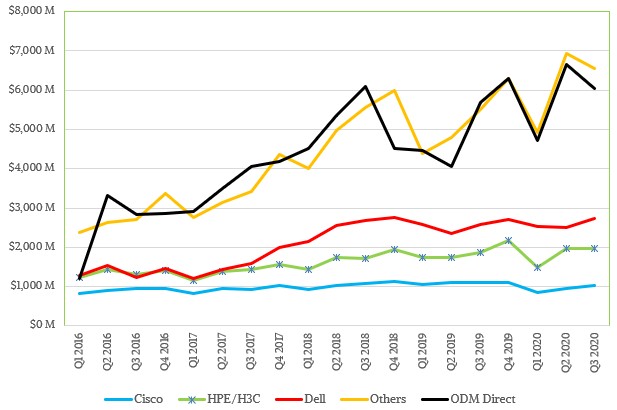
When it comes to cloudy infrastructure, there are obviously still a lot of different vendors who sell this infrastructure, either as piece parts acquired individually or as complete systems that roll into the datacenters in racks and need only power cables and network cables before they are ready to run. Here is the distribution of IDC’s reckoning of how the top three OEMs have done alongside the ODM collective (about six major companies). The public data does not go back far enough for us to break out Huawei Technology, Lenovo, and Inspur, but generally speaking, Huawei and Lenovo are catching up to Cisco Systems and Inspur, partly due to its partnership with IBM in China, has already surpassed Cisco. IBM itself does not make the top five cut, which is a sad commentary for a company that is called International Business Machines.
Anyway, here is the trend chart for cloud infrastructure sales by vendor:
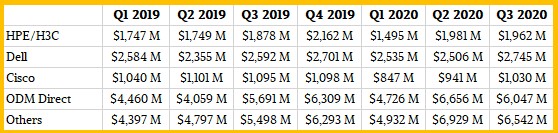
And here is the summary data for 2019 and the first three quarters of 2020:
Isn’t it funny how tightly the ODM collective and the other vendors outside of Dell, Hewlett Packard Enterprise, and Cisco Systems track each other? That’s just weird, isn’t?


Oracle Puts AI, Automation Between Its Cloud And the Bad Guys
Despite a slow start several years ago, Oracle has refashioned itself into a cloud builder, rapidly expanding its Oracle Cloud Infrastructure to make it among the top second-tier providers, although still well behind the likes of Amazon Web Services, Microsoft Azure, and Google Cloud. The longtime database and middleware giant …

Server Hunger Is Stronger Than Economic Uncertainty
The appetite for compute capacity, and presumably also for storage and networking capacity, in the datacenter of the world might be waning in some sectors of the economy, but thanks to the voracious hunger of the hyperscalers and cloud builders and more than a few large enterprises that need to …
Nvidia Hints At Upcoming AI-Focused Spectrum-4 Ethernet
It is no surprise at all that Nvidia’s datacenter business is making money hang over fist right now as generative AI makes machine learning a household word and is giving us something akin to a Dot Com Boom in the glass houses of the world. It is also no surprise …
Be the first to comment