The appetite for compute capacity, and presumably also for storage and networking capacity, in the datacenter of the world might be waning in some sectors of the economy, but thanks to the voracious hunger of the hyperscalers and cloud builders and more than a few large enterprises that need to do more, not less, computing in the face of the coronavirus pandemic, server sales are now consistently at the levels we saw way back in the Dot-Com Boom more than twenty years ago.
In the second quarter ended in June, the market researchers at IDC reckon that the world consumed a whopping 3.19 million shiny new machines, up 18.4 percent from the prior year’s second quarter, which was admittedly a bit soft at 2.69 million machines sold but still huge by the standards of the past several decades. The original design manufacturers, or ODMs, who make custom machinery for the hyperscalers and cloud builders and a very small number of large enterprises, accounted for juts under 1.1 million machines, or 34.4 percent of total shipments, a significant jump from the 25.2 percent share in the year-ago period. Dell, Inspur, Lenovo, Supermicro and a few other original equipment manufacturers, or OEMs, who sell predesigned machines to end user customers but who also sometimes work as ODMs for selected customers, also have a sizeable chunk of shipments to the hyperscalers and cloud builders, but we don’t know how much.
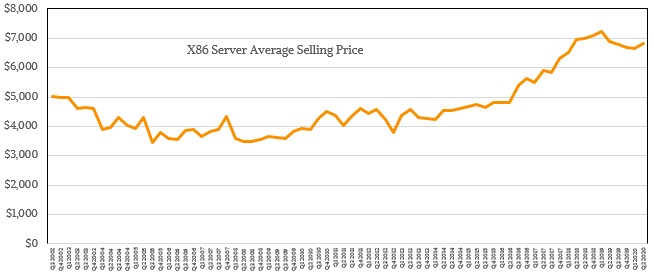
Our best guess is that the hyperscalers and cloud builders account for about half of total server shipments now, and slightly less than half of the aggregate revenues. The high volumes sold to these customers drives down unit prices for CPU-only machines, as you might imagine. But there are also machines that have lots of main memory, and flash and 3D XPoint storage as well as GPUs and sometimes FPGAs, and this drives up the average selling price curve significantly, as does the cycles of IBM’s System z mainframes and Power Systems RISC servers. At the moment, the System z15 is waxing and the Power9 is waning, and on balance IBM is a little ahead and thus sales of non-X86 iron overall is also helping to drive up average selling prices. On balance, in the X86 server market by itself, average selling prices have been hovering at around $7,000 a pop for the past two and a half years, as you can see in the chart below, which spans from now until back to Q3 2002, when IDC first started taking about the X86 server business as an entity in its public documents:
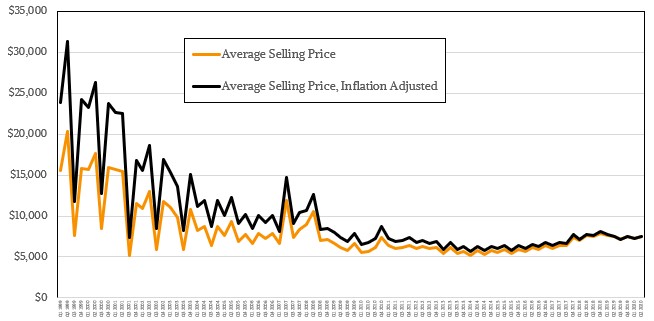
The dip in the chart above in 2019 and into 2020 has to do with DRAM and flash prices collapsing, and for the moment things have settled down to a more reasonable balance across CPUs, memory, and flash in servers. This doesn’t give you a complete picture of selling prices over the span of decades, so here is a chart that runs from Q1 1999 through Q2 2020 and it includes all types of servers as well as the raw sale price and the inflation adjusted selling price in 2020 dollars. If you are making comparisons over such long spans of time, you really need to take into account the depreciation of the US dollar over time. Take a look:
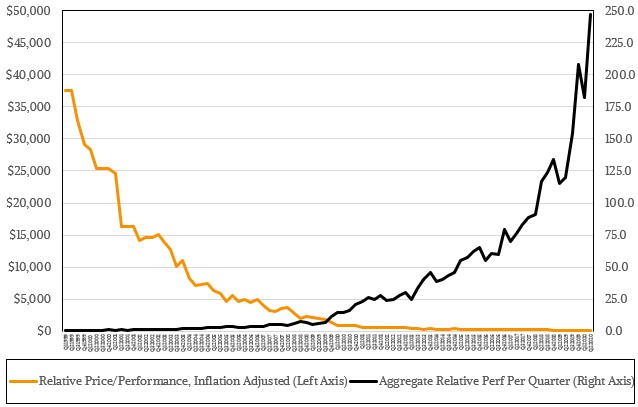
Not only has the cost of a server come way, way down since 1999 – by about a factor of 4X from the peak in 1999 when a lot of RISC/Unix and IBM mainframe machines were selling like crazy at the same time – but the number of machines sold each quarter has expanded by a factor of 4X or so as well. When you add in the amount of compute capacity per CPU to the equation, then we think that the overall aggregate amount of compute sold in Q2 2020 is about 437X that sold in Q1 1999 and that the price/performance has increased by a factor of 250X at absolute dollars and by 370X dollars in inflation adjusted dollars. Here is what that long view looks like based on our models, which in turn are based on the shipment and revenue numbers generated by IDC:
Those are, over that long haul, some pretty sweet exponential curves, and we have the innovation of CPU makers and their foundries to thank for this. But here is the thing you really need to chew on to understand the level of automation we have in this economy, the smallest piece of which is actually processing transactions. In the second quarter of 2020, by our estimates, there was about 250X the amount of raw compute capacity that was sold in the fourth quarter of 2000, the peak of the Dot-Com Boom. Another way of saying that is that we have crammed the capacity of what would have been 90 million servers of the late 2000 vintage into just under 3.2 million machines.
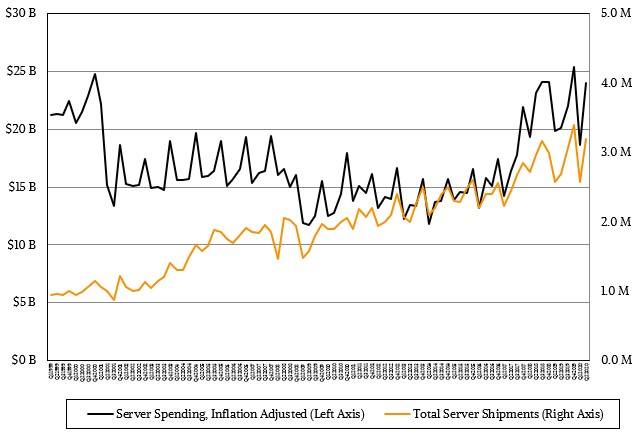
But don’t think that the spending that we have been seeing since the end of the Great Recession, or indeed since the beginning of the Dot-Com Bust in early 2001, is anything like what we saw during that Dot-Com Boom. If you look at inflation adjusted data, which we have done in our model, it is only since the end of 2017 that we came close to the spending levels that we saw at the peak in 2000, and it has taken several years for us to reach the same levels more or less consistently, as you can see from the chart below:
Because so many of us are working at home and also getting information and entertainment through the web of infrastructure still called the Internet, the coronavirus has not really hurt server sales. The transportation and hospitality sectors of the global economy have taken their hits, to be sure, but the need for more capacity, right now, is larger than any fears about the economy in the coming quarters. We have no idea how much excess capacity the hyperscalers and cloud builders keep on hand, but it is probably not much more than 25 percent to 30 percent, and it could be far less than that if they have a continuous flow of new machines into and old machine out of their datacenters. (We suspect that it is a bit choppy across any one company, but leveling out across the Magnificent Seven or Super Eight.) The point is, like most companies, they have to have excess capacity and then burn it off, even if the product they are selling doesn’t show the capacity behind their software as a service, whether or not it is free, or meters it and gives the illusion of infinite capacity, which it certainly is not on a public cloud even if that capacity is very, very large by the standards of any single enterprise customer.
As has happened a lot in the past, the middle of the server tiers did not do so well in the second quarter as the top and bottom tiers. For machines in the volume server segment, which is where systems cost $25,000 or less, revenues were up 22.1 percent to $18.7 billion and comprise the vast majority of the market, which is shaped like very short but very wide pyramid. The midrange market, which is for systems that cost between $25,000 and $250,000, was down four-tenths of a percent, to $3.3 billion. This is still an important market – particularly for customers who use RISC and sometimes mainframe machines as mission critical, back-end systems of record – but it has been shrinking relative to the rest of the market for a long time. The high-end of the market, which includes fat NUMA servers based on Xeon, Power, System z motors, was up by 44.1 percent to $1.9 billion.
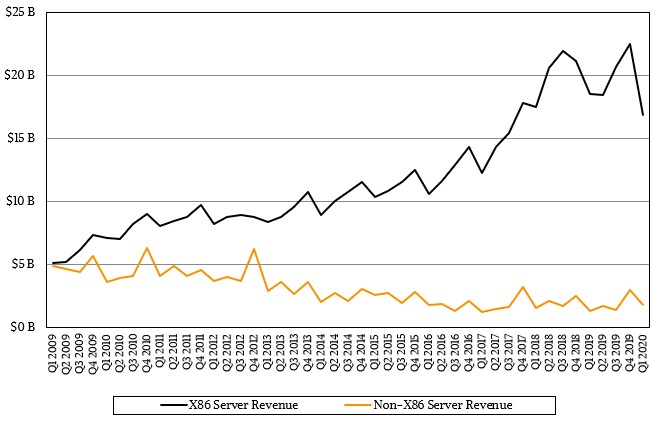
Systems based on the X86 architecture, which include machines based on Intel Xeon SP and AMD Epyc processors, accounted for $21.6 billion, up 17.4 percent in the second quarter, while sales of machines based on other processor architectures grew 47.4 percent to $2.4 billion. The growth of the latter is largely due to the System z15 mainframe sales at IBM, but Arm-based servers are also seeing some uptake and that is helping a little, too. IBM’s $1.45 billion in sales in the quarter for Power Systems and System z iron, which rose 22 percent year-on-year, accounted for $58.6 percent of the non-X86 server market. Believe it or not, this is a little bit lower than average, and that is because the Power9 processor entered the long tail of its cycle a few quarters ago.
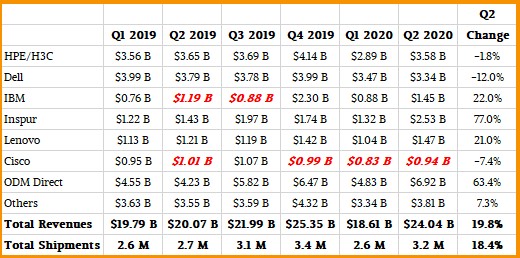
Looking at the IDC data by vendor, a few things stick out. Here is the tabular data, showing the change quarter on quarter for Q2 2020 in the far right column:
The items in red bold are estimates because in these cases, IBM or Cisco Systems did
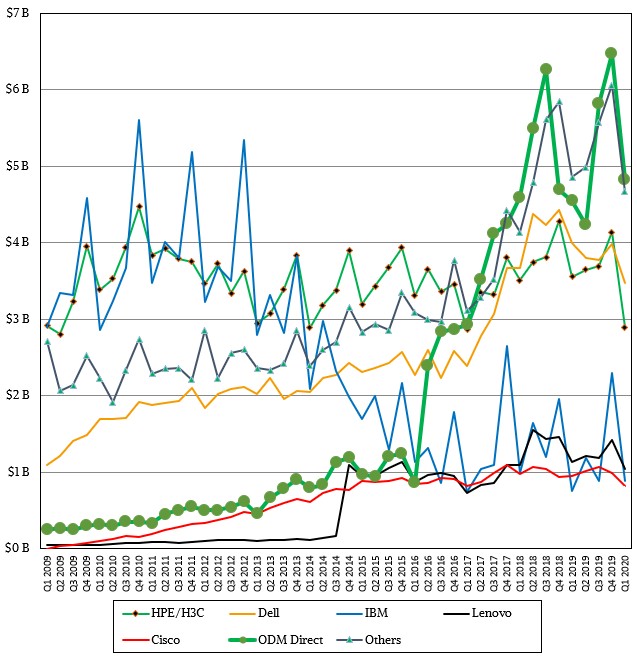
And here is the chart so you can see the trends over a longer period of time:
First, Hewlett Packard Enterprise is back on top with $3.58 billion in sales, down 1.8 percent and helped in part by the acquisition of supercomputer maker Cray but also by other factors, compared to Dell at number two, down 12 percent to $3.34 billion. Chinese server giant Inspur keeps embiggening itself, growing revenues by a stunning 77 percent to $2.53 billion and, significantly, beating the growth of the ODM vendors as a group, who posted their largest combined sales to date, at $6.92 billion, up 63.4 percent. If you take Inspur out of the market, then overall server revenues only grow by 15.4 percent, and if you take out the ODMs too, then the market only grows by 1.3 percent. IBM and Lenovo had decent growth, and so did the Others as a collective.
But this server spending tide is not raising all boats equally. And we have no idea when and if the tide is going to go out for a quarter or two, either.



Be the first to comment