

There is some uncertainty about global IT spending in the broadest sense in 2023 and beyond, and but Synergy Research, which watches the cloud segment like a hawk, is very bullish on cloud spending in its various guises.
In fact, the company reckons that across the cloud services and infrastructure sectors. Total spending revenues for cloud operators and hardware, software, and services vendors – what it calls the public cloud ecosystem – rose by 21 percent in 2022 to reach $544 billion, and says further in its forecast that sales across that cloud ecosystem will double to over $1 trillion in the next four years.
Doubling would mean $1.09 trillion in sales. That is a compound annual growth rate of 26 percent over those four years, and because Dinsdale is not at liberty to say what the 2023 projection is – Synergy Research has to make a living, too – we have to assume this 26 percent CAGR as a proxy for 2023’s growth.
As we reported by in October, Gartner has cased what it calls “Datacenter System” sales at $189.5 billion in 2021, growing by 10.4 percent to $209.2 billion in 2022 with a projected – and decelerating – growth of 3.4 percent to $216.3 billion in 2023. If you add in software and IT services to get a proxy for core IT spending, then Gartner believes that this core IT spending rose by 12.8 percent to $2.13 trillion in 2021. And perhaps more significantly, Gartner is only projecting 6 percent growth in that core IT spending number to $2.26 billion in 2022 and says further that growth will be 8.7 percent in 2023 to $2.45 trillion – with growth driven almost entirely by an increase in enterprise software spending.
What is clear by comparing these two datasets is that the cloud ecosystem is growing faster than IT overall and looks to continue to do so in the year ahead and very likely beyond.
Interestingly, Synergy Research says that the number of “operational hyperscale datacenters” would increase by only 50 percent over that time. John Dinsdale, chief analyst and research director at Synergy Research, adds that datacenter network capacity will increase by over 65 percent over the next four years.
Counting “hyperscale” datacenters – not cloud regions, but the self-contained datacenters with a single network linked all of their gear into one massive virtualized machine that in turn comprise a cloud region – is interesting. But you have to always remember that some of these datacenters are for internally developed applications at what we at The Next Platform call “hyperscalers” that run on their infrastructure but cloud hardware underpinning it is a cost of goods sold. Some hyperscalers are not in the cloud business at all, like Facebook in the United States and ByteDance in China (which has a few dozen applications including TikTok). In the United States, Google, Microsoft, and even AWS have application and storage services that are really best classified as SaaS, and ditto for Alibaba, Baidu, and Tencent. We bring this up not to pick, but to point out that when we say “hyperscale” we mean a very precise thing – it means those apps that are free or cheap and the iron and software that comprise it. We do not mean cloud, which means capacity in some form for rent.
“We track this very closely,” Dinsdale says of the hyperscale datacenter figure in talking to The Next Platform. “In December the number of operational hyperscale datacenters passed the 850 mark. The numbers is growing by ~100 per year. These are all large datacenters and exclude CDN nodes, small local POPs, and relatively minor edge deployments. It also excludes all datacenters that are in the pipeline (being planned, developed or soon to be launched). That adds another 420 datacenters.”
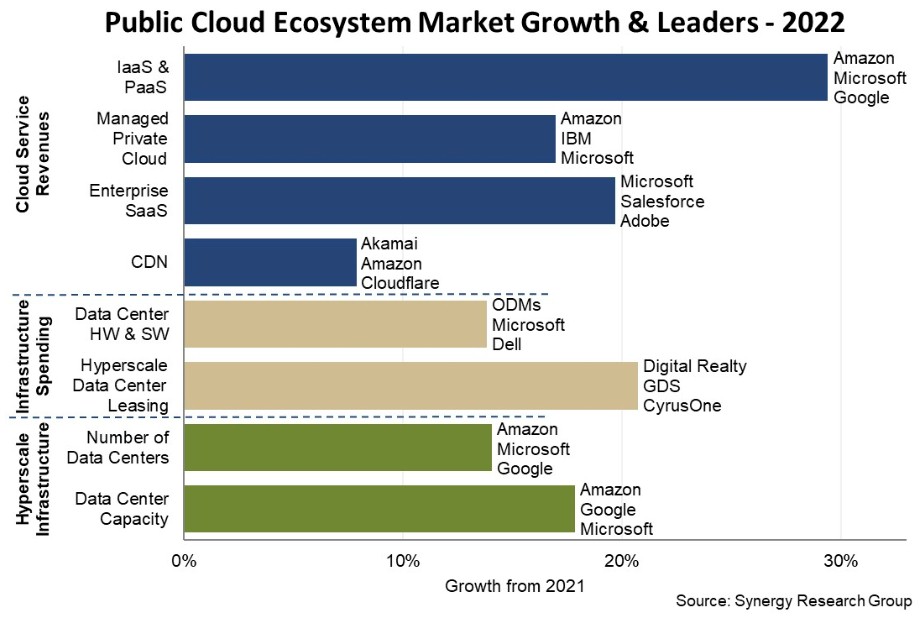
Here is the chart that Synergy Research put out casing the public cloud ecosystem in 2022:
We don’t use the word “public” to talk about clouds anymore, since there is nothing public about this. Cloud are indeed utilities, but they sure as hell are not regulated like other public utilities governing the distribution of electricity, natural gas, or water most certainly are.
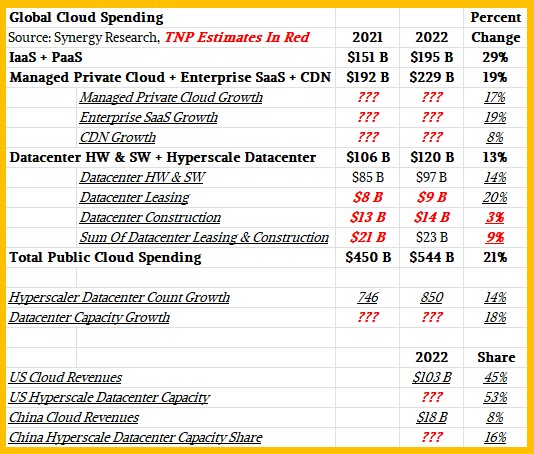
The chart above shows growth rates, not revenues, so be careful when you look at it. We looked at the few figures in the Synergy Research executive summary and other comments that Dinsdale made to us and cooked up this table that gives you the revenue levels as well as the growth rates of the data put out by Synergy Research:
To get the growth rates for the chart, we printed out the chart and measured the bars, and once we had that, we could figure out the revenues for 2021 for certain parts of the Synergy Research data. Dinsdale told us that The $120 billion in datacenter hardware and software sold for clouds and hyperscalers in 2022, 81 percent was for hardware and software acquired and 19 percent was for datacenter leasing (both gear and facilities) and for construction of physical datacenters.
We did not have enough data to figure out how much was for datacenter leasing and how much was for construction, but if you make one assumption you can calculate all of the missing data under the datacenter. What we know is that the Datacenter Construction bar, which is missing from the Synergy Research chart, must have been very modestly growing or down for the overall category to only grow by 13 percent when two of the subsegments grew by 14 percent and 20 percent as calculated from the bar chart. The numbers shown in bold red italics are out estimates based on a 40-60 split between datacenter leasing and datacenter construction in 2022.
We are not confident enough of the Managed Private Cloud, Enterprise SaaS, and CDN segments to make estimates, but we have shown the growth rates from the bar chart.
As you can see, this “public cloud ecosystem” dataset mixes datacenter hardware and software spending by clouds with end user spending on clouds, and we can debate the wisdom of that. But having the data broken out separately, as Synergy Research presents it, means we can tear it apart. To our way of thinking, the spending on datacenter capacity is a cost of goods sold for the actual cloud IaaS and PaaS services that are sold. And similarly, SaaS vendors that runs their applications on one or more of the clouds has an IaaS or PaaS service as a cost of goods sold for their SaaS offerings.
Synergy provides a breakdown of cloud revenues and cloud capacity for the United States and China, and as you can see from the table, the United States utterly dwarfs China in terms of revenues. We don’t know the capacities of these datacenters – expressed as megawatts of critical IT load – because Dinsdale is keeping that to himself, but we do know that the US stands at 53 percent of megawatts compared to 16 percent for China.

Oracle Goes Massively Parallel, Low Cost With Exadata Exascale
Maybe, if you need blazing performance extracting data and chewing on it from a relational database, it belongs in a cloud. Because for certain workloads, including vector search and retrieval augmented generation, having a blazingly fast database – and one that can scale from terabytes to petabytes of capacity – …

Google And Dell Pave The Way For File Data In The Cloud
A year ago, Dell Technologies made a significant push deeper into the fast-growing hybrid cloud space, unveiling its Dell Technologies Cloud initiative that includes hybrid cloud platforms that take advantage of the tight integration of technologies from Dell and VMware, which is majority owned by the larger company. The platforms …
Co-Location Plays A Big Role In Hybrid Cloud, Too
In the ongoing discussions about the still-evolving world of hybrid cloud, the focus tends to be on what enterprises are doing within their own on-premises datacenters – and private clouds – and their work with public cloud players like Amazon Web Services, Microsoft Azure, and Google Cloud. Lost at times …
Be the first to comment