Our increasingly networked and compute-intensive lives are driving the server business, and despite the cornucopia of fear, uncertainty, and doubt that spans the globe, the appetite for compute as expressed in shiny racks of servers or metal pizza boxes or an occasional tower sitting in a closet or under a desk continues despite the kind of consumption we have not seen since the dot-com boom. And so, the third quarter of 2020 was not bad at all. And it was good, despite some of the talk that hyperscalers and cloud builders might take a pause for “digestion.”
That could still happen, of course, but according to the data coming out of IDC, it did not happen in the third quarter of 2020, at least in terms of revenues. As best as we can figure from the models that we have built atop the quarterly data coming out of IDC, it takes about three times as many machines to generate the same level of spending as was prevailing in the late 1990s and early 2000s before the first Internet wave crested and crashed onto the rocky shores before going out for a long tide. That is looking at the server market with inflation adjusted revenues, which we think is appropriate given the time value of money and the two decade span of the dataset we have built upon.
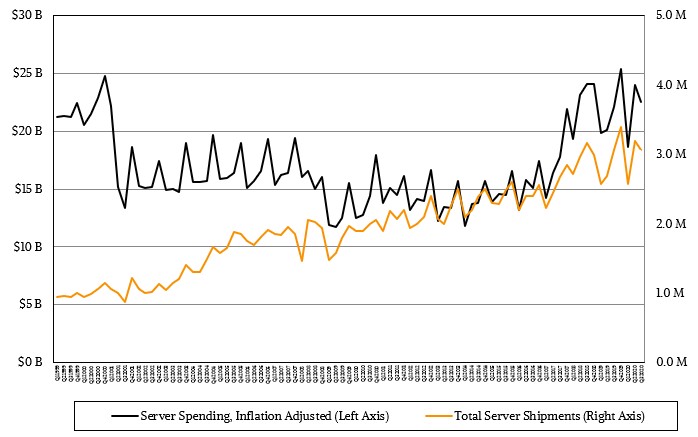
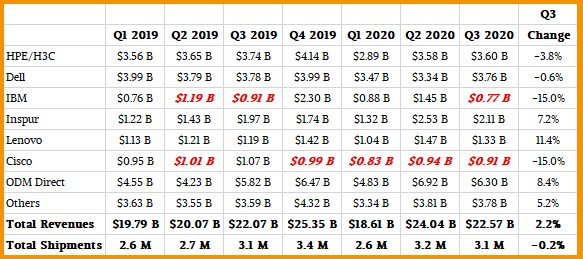
In the quarter ended in September, IDC reckons that server revenues rose by 2.2 percent to $22.57 billion, but shipments were off two-tenths of a percent to 3.07 million units. As we have pointed out in previous analyses of the server racket, that is three times the roughly 1 million units per quarter that were shipped in 1999, where revenues averaged around $14 billion a quarter. In 2000, revenues rose by 7.5 percent or so, and shipments rose by about the same amount, and in 2001 the bottom fell out. Take a look:
The data above is the raw IDC server data, which has been made available each quarter since 1996, adjusted for inflation effects based on the prevailing inflation rate each year and expressed in 2020 dollars. (We did this math, IDC did not.) As you can see, we hit a very big peak in 2000, and then had basically a decade and a half of plateau until the massive consumption – some might say epic consumption – of servers. The shipments have been rising steadily, more or less, throughout this period, and that capacity and the revenue it represents has been driven by a number of factors. First, the shift from proprietary and RISC/Unix machines to X86 iron running Windows Server and Linux. Second, the wide adoption of Internet technologies and the distributed systems it enables (or, some might say, requires). And third, in recent years, ever more compute intensive machines with expensive CPUs and GPUs and fat memory and flash. Add it all up and the revenue levels since about the end of 2017 – again, at inflation adjusted levels – started to match that peak we saw in 1999 and 2000. If you make some estimates, as we have, the amount of raw capacity sold across all customers in a quarter has gone up by about a factor of 368X and the bang for the buck has improved by 257X between Q3 1999 and Q3 2020, and the amount of compute in a single node has risen by about 114X.
This is not perfect elasticity, mind you, in the economic sense. But it is pretty close, with companies consuming more as it becomes cheaper, driven by need not desire. These machines, you must remember, have to pay for themselves.
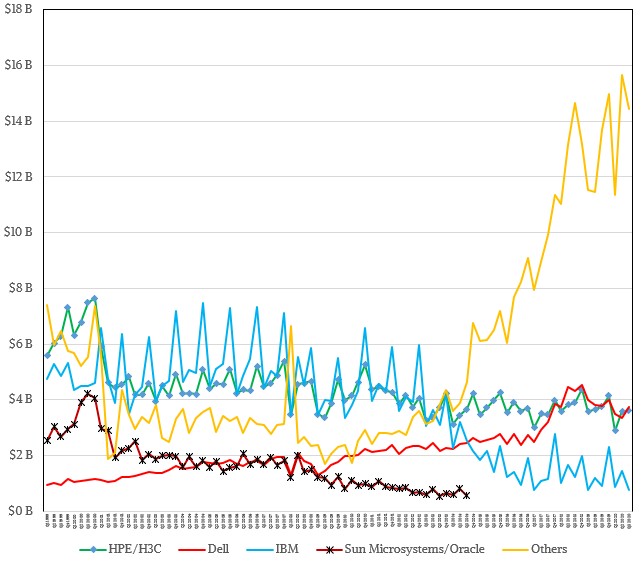
Who is getting the money here? The inflation-adjusted vendor chart over the past two decades is fascinating, so let’s have a look:
Oracle has not stopped selling servers, it is just that we can’t see the data anymore because they are not in the top five or six. And because IBM and Cisco Systems and Huawei Technology are often in the top five or six, we can see how they are doing and make some educated guesses about where they are so we can fill in some gaps that IDC doesn’t make public.
A few things are obvious from the chart above. Dell’s red line rose steadily but has pretty much gotten in phase with Hewlett Packard Enterprise in the past two years or so. The initial merger with Compaq back in 2001, which we backcast into 1999 and 2000 to show how big these two companies were, would have created a true powerhouse if the dot-com boom had not gone bust and the deal had not closed the day before 9/11. The new HP was slammed and has been trending down slightly ever since, but still pretty steady given all of the changes at the company and in the market. IBM sold off a big chunk of its business when it sold its System x division to Lenovo in 2014, and you can see the effect of that. And the last big thing that jumps out is the sales of Others, which includes companies like Inspur, Sugon, Lenovo, and the many ODMs who supply the hyperscalers and cloud builders.
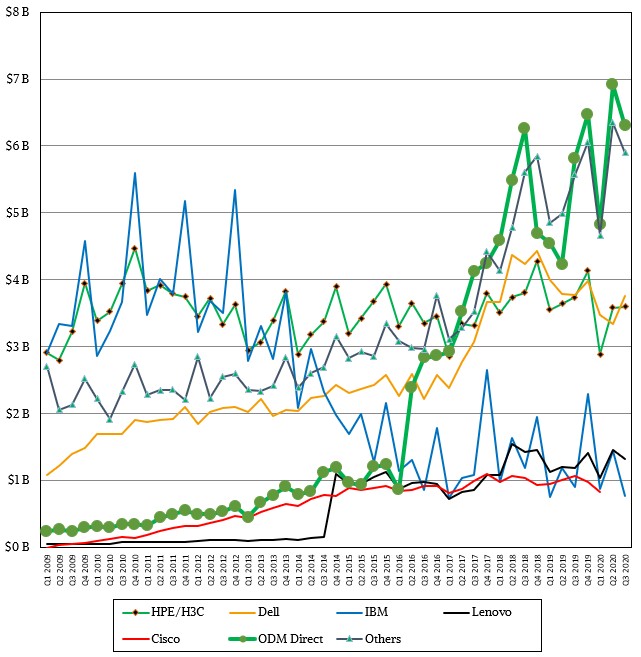
Here are the server revenues by vendor since the belly of the Great Recession back in Q1 2009, which provides a little insight into those others:
This data in the chart above is not inflation adjusted – we just have not gotten around to it and the effects are not as pronounced across one decade as they are across two. In any event, you can see the rise of the original design manufacturers, who almost exclusively make machines for the hyperscalers and cloud builders. (Some of the latter also buy from the quasi-ODM units within more traditional original equipment manufacturers, or OEMs, such as IBM, Dell, HPE, Cisco, Lenovo, and so forth.) The ODMs and these ODM-like units account for a very large portion of the revenues and shipments in the server market – it is hard to say for sure, but it is probably somewhere around 45 percent of shipments and maybe just south of 40 percent of revenues.
Let’s get a little finer grained and talk about the past couple of quarters. Here is a table by vendor:
HPE and Dell have been leapfrogging each other as the top revenue generator in the server space, and this time around in Q3 2020, Dell came out on top with $3.76 billion in sales, off six-tenths of a percent from the year ago period. Dell and HPE were neck and neck this time last year, but this time around HPE saw revenues slip by 3.8 percent to $3.6 billion. IBM didn’t make the cut of the top five vendors this time around, and neither did Cisco, but we did our best to estimate it to make a consistent presentation. In the official IDC numbers, Inspur – including its Power server partnership with Big Blue to sell such machines inside China – saw revenues grow by 7.2 percent to $2.11 billion, giving it a third ranking worldwide. Lenovo came in at number four, with 11.4 percent growth to $1.33 billion, followed by Huawei with 19.9 percent growth to $1.1 billion.
The ODM suppliers (not including the units of the OEMs that sell to the hyperscalers and cloud builders) accounted for $6.3 billion in revenues in the third quarter, up 8.4 percent year on year; they collectively had 980,024 server shipments, up 10.3 percent. The rest of the market (in the IDC numbers and including machines from IBM and Cisco) accounted for 511,482 machines, down 4.9 percent, and drove $4.37 billion in revenues, down 6.3 percent. IBM and Cisco were big drags on this category, we reckon.
In the third quarter, not surprisingly X86 servers (including those using AMD Epyc processors as well as those using Intel Xeon SP motors) accounted for just under $21 billion in sales, up 1.6 percent. Interestingly, sales of servers using AMD Epyc chips were up by a factor of 2.1X, according to IDC. Non-X86 server sales were hurt by flagging sales of IBM mainframes and Power Systems machinery to a certain extent, and helped by Inspur’s Power server sales (to an extent we cannot see in the public IDC data) and a 5.3X increase in Arm server revenues. We are not sure where this revenue is being reckoned from, but we suspect that it includes sales of machines based on Marvell’s ThunderX2 processors and Ampere Computing’s Altra processors as well as some sales of HPC machines based on Fujitsu’s A64FX processors. But a lot of it is probably ODM iron built for Amazon Web Services using its own Graviton2 processor. Both AMD Epyc and Arm as a collective are starting from relatively small bases.
If you are looking for where the real growth was, look to China, which had a 14.2 percent increase in server spending in the third quarter. Japan had a 21.4 percent decline, and the rest of the Asia/Pacific region, excluding China and Japan, had 3 percent growth in server spending according to IDC. North America had a 1.8 percent growth rate and Latin America had a 1.5 percent growth rate for server spending in the period. Europe, the Middle East, and Africa had a 4.9 percent decline. So, perhaps the US-based hyperscalers and cloud builders are going through a “digestion” phase, but the Chinese hyperscalers and cloud builders do not seem to be.



Very interesting article. I come back to this data all the time. the rise of the white box server is especially intriguing.
How do you source and validate this data?
IE is driven by an bottoms up spend by fortune 500 companies or just the public cloud spend from the big hyperscalers?
Any trends you can pick up, IE is there a growing move away from the hyperscaler to in house private cloud?