
It will not happen for a long time, if ever, but we surely do wish that Amazon Web Services, the public cloud division of the online retailing giant, was a separate company. Because if AWS was a separate company, and it was a public company at that, it would have finer grained financial results that might give us some insight into exactly what more than 1 million customers are actually renting on the AWS cloud.
As it is, all that the Amazon parent tells Wall Street about its AWS offspring is the revenue stream and operating profit levels for each quarter. Granted, this is a fairly new business and while the success of AWS has been nothing short of meteoric, it has only been a few years that Amazon felt that the revenues and profits from AWS were material enough to talk about publicly. To be fair, if materiality was a legal distinction, Amazon probably would have had to disclose its AWS numbers even a few years earlier than it did. No matter. Everyone was building spreadsheets anyway, showing the basic shape of the AWS revenue streams and profit pools. We were no exception, as this chart below, rolling all the way back to the end of the Great Recession, shows:
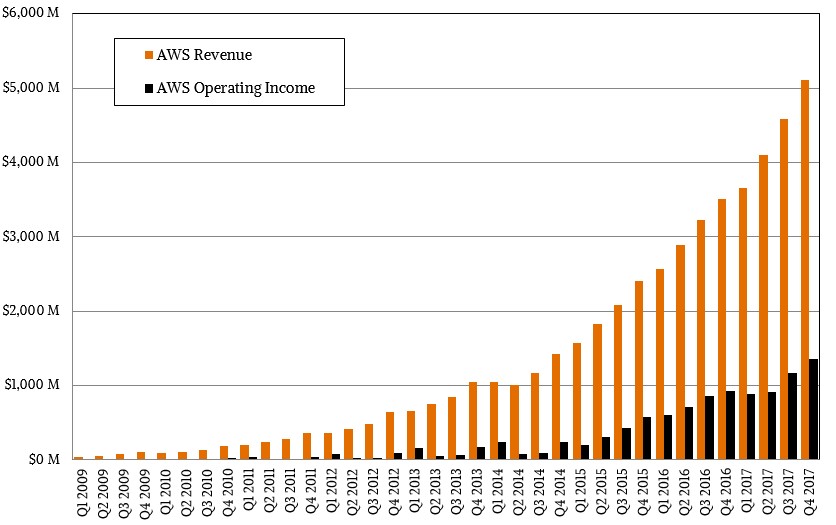
Our estimates go all the way back to the first quarter of 2006, when AWS started out with the Elastic Compute Cloud (EC2) service, which was followed up soon thereafter by the Simple Storage Service (S3). Yes, Amazon could have been more consistent in its naming like IBM back in the 1960s and 1970s. AWS was pretty tiny back in 2006, we reckon that the cloud computing unit had $21 million in sales and had an operating loss of $13 million. Revenues tripled in 2007 and 2008, and losses shrank until the company hit break even in 2009. Revenues and operating income both doubled every year between 2010 and 2012, inclusive and growth started to slow a bit to the 80 percent range in 2013 and slowed after that as every market and every player in any market ultimately does. During 2017, AWS sales rose by 43.2 percent to $17.49 billion, and operating profit, which at $4.33 billion, was 24.8 percent of revenue and was also up by 39.3 percent.
Amazon is not just an amazing technical engineering company, but a brilliant financial engineering one in that it is able to keep Wall Street so happy for so long based on a dream in retail and then save its financial cookies by creating an IT services company that actually makes good on its profit promises in a way that its retail operations never can. Someday, Amazon may be a giant IT, space transport, healthcare, and media company that also happens to have a retail arm.
Exiting the fourth quarter, AWS has an annualized run rate of $20 billion, and it is far less cyclical and far more profitable than the overall Amazon Empire. Revenues in the fourth quarter across all of its compute, storage, networking, and software products added up to $5.11 billion, up 45.8 percent year on year; operating income rose a little bit faster, at 46.2 percent, to hit $1.35 billion, a cool 26.5 percent of revenues. This is a hardware and software company that has margins like a traditional enterprise application software company like Oracle and Microsoft in their best years. Amazon has successfully turned its own IT problems as a giant online retailer into a vast profit engine – and in a way that none of the historical IT suppliers was able to do and, frankly, should have been able to do.
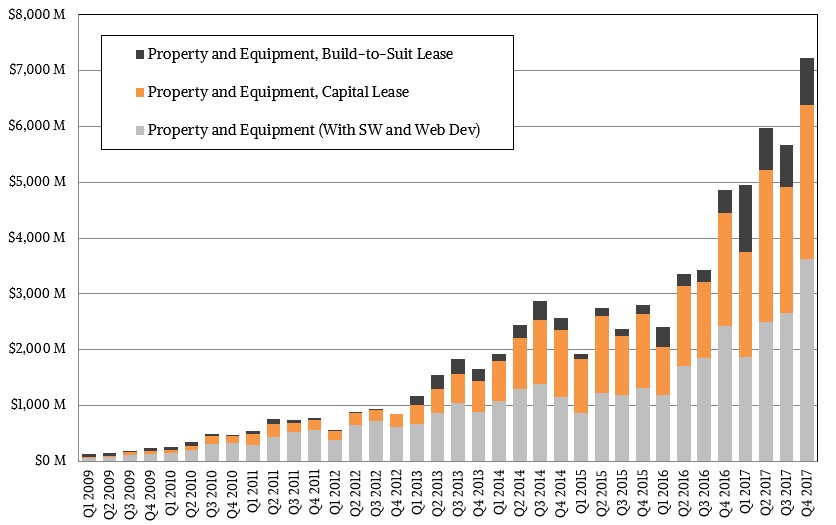
They should be embarrassed, really. But that is the thing about scale. None of them ever had IT operations and data needs that were even close to that of Amazon, much less the combination of Amazon and AWS. You can’t learn hyperscale on traditional online transaction processing against a relational database. You have to have scale break before you can fix it. And you have to be willing to tell Wall Street to wait, which it can for Amazon but which it will not for IBM, Dell, or Hewlett Packard Enterprise, thanks to its Internet darling status. The capital equipment investments for both the retail and AWS businesses have been immense, and too rich for the blood of all but the existing hyperscalers (who have no choice) and the big telcos and service providers (who act like they have no choice when maybe they do). Take a look:
A few years back, when AWS was growing at triple digits, we pointed out the obvious fact that the division could not keep growing at this rate because it would very soon be larger than the entire global spending on IT hardware, software, and services. That is not a scenario that can hold up. There are natural curves in any market, and we made the argument back then that this flattening in sales of infrastructure and systems software for AWS would eventually compel it to get into delivering application software, akin to Oracle, Microsoft, SAP, and countless others. This is a very fat and juicy market in terms of profits, and the software people use is almost as sticky as their underlying databases.
We are happy to report that AWS is more or less tracking to the scenario of growth that we expected when we pondered its growth prospects two years ago. (See How Long Can AWS Keep Climbing Its Steep Growth Curve? for more on that.) The brackets on growth, as we pondered them then, were that AWS could grow linearly for the next decade at 70 percent a year (Scenario One in the chart below) and grow a little in 2016 and then hit a wall and only grow at the rate of global gross domestic profit (Scenario Five).
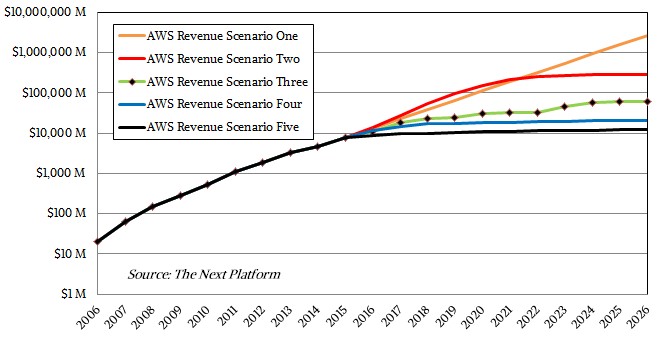
With Scenario Three, shown in green with the black diamonds, we assumed that AWS gets aggressive about price cutting because of competition with Google and Microsoft and growth actually stalls a bit, but picks up again in 2017. Then, as the business reaches its natural – and still by far dominant – share of the cloud market and piece of the overall IT market, growth bounces between 5 percent and 25 percent depending on the stimulus AWS applies to its pricing. We said then that this is a kind of wiggle pattern that looks has been emerging from the most recent quarters and years at AWS, and warned that, as they say on Wall Street, past performance is not indicative of future performance. But again, noted that this pattern gets Amazon to north of $62 billion in revenues a year by 2026 – a little smaller than Amazon minus AWS back as 2015 was ending – without anything looking like too crazy of a growth rate or too high of a slice of the IT market.
This appears to be happening, give or take.
The one thing really want is some visibility into what is going on inside of AWS in terms of revenues and profits. At the moment, AWS is a black box and the company says very little about what those 1 million plus customers that use its services are buying. Just for fun, we took a stab at modeling the breakdown of AWS revenues, which we show running from 2009 through 2017, inclusive, in the chart below:
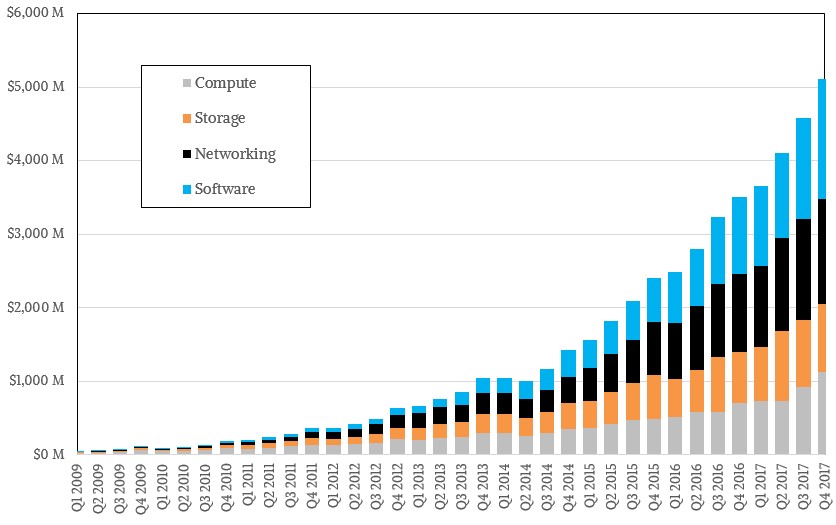
This is a straight up guess, but it is an informed one. If you wanted to treat AWS like it was an infrastructure company, you might be tempted to take the distribution of global spending on servers, storage, networking, and systems software and just map it onto the revenue stream. That is a very rough way of doing it, particularly since AWS was very heavy on compute at first, then compute and storage, and then started adding services that are really akin to high level systems software (like databases and datastores) and even low level application engines (Lambda is not quite an application, but it is close). We think you have to dice up the revenue stream of AWS as if it was a company that invests a lot in hardware as well as uses a mix of open source and homegrown software and is allergic to buying third party software that has a very high price tag and high ongoing maintenance costs. In the IT market at large – meaning enterprise IT – for every dollar spent on compute, storage, and networking, there is close to another two dollars spent on systems and application software above and beyond the basic operating systems. This is not the distribution at AWS, we are certain of that.
In the overall IT segment, when it comes to datacenter hardware, about half the spending is on servers, with about a quarter on storage and the remaining quarter on networking. The networking and storage shares of that hardware pie have been creeping up over the years. We think, based on the anecdotal evidence, that the portion of AWS revenue derived from compute is lower than you might expect from the ratio, and dropping over time. AWS wants to make compute cheap and easy, and get people addicted to the cheap object storage and pay a premium for the block storage and the networking to move data between clusters and across datacenters and regions.
If we had to guess, we would think that AWS is moving towards a business model where compute and storage are getting cheaper a lot faster than networking (which is a reflection of costs at hyperscalers) and that an increasing amount of the revenue stream is coming from higher level services, ranging from databases and datastores to AI machine learning training to higher order things like Lambda functions, which are extremely nascent. We think that networking is the profit engine at AWS at the moment, but in time, AWS will derive most of its profits from the combination of networking and higher level software services. And, when it needs to stimulate demand and can afford to, in terms of the hit to profits, it will next cut networking costs and help to make the overall virtual system stack cheaper, putting pressure once again on those who still want to do IT themselves. By then, we think, AWS will have lots and lots of customers for its rich software services, and that will keep the profits rolling in. At least, that is what we would do if we were AWS.

Nutanix Stretches Across The Hybrid Clouds
Surviving in an ever-evolving and fast-changing industry like IT requires companies to understand the landscape, see where the trends are going, and be willing to adapt to what’s happening in front of them. IBM has been a master of this. Punch cards are long gone, and while the company still …
Object Storage Makes A Push Into HPC
Four years ago, Cloudian was a six-year-old startup in an object storage space that, while the technology had been around for more than a decade, was seeing a surge of interest from cloud providers desperate for a storage architecture that only could scale to meet the demands of their rapidly …

Kubernetes Clusters Have Massive Overprovisioning Of Compute And Memory
In the ten years since Google released Kubernetes to the open source community, it has become the dominant platform for orchestrating and managing software containers and microservices, along the way muscling out competitors like Docker Swarm and Mesosphere. (Remember those? In a decade, you won’t.) Those building software stacked embraced …
Be the first to comment