

There has been much discussion about the “black box” problem of neural networks. Sophisticated models can perform well on predictive workloads, but when it comes to backtracking how the system came to its end result, there is no clear way to understand what went right or wrong—or how the model turned on itself to arrive a conclusion.
For old-school machine learning models, this was not quite the problem it is now with non-linear, hidden data structures and countless parameters. For researchers deploying neural networks for scientific applications, this lack of reproducibility from the black box presents validation hurdles, but for production users of deep learning frameworks, there are other problems with this lack of insight into network behavior, particularly in terms of optimizing models for better performance, efficiency, and accuracy.
One solution to this has been visualization of neural network models—something that social media giant, Facebook, in conjunction with researchers at Georgia Tech, has focused on. Facebook’s deep learning use cases go beyond image analysis, which means disparate data types being fed into models. Unfortunately, most tools for neural network visualization focus on image datasets, which spurred research into a tool in production use at Facebook called ActiVis, which is an interactive visualization system for interpreting large-scale neural network models and outcomes.
The Georgia Tech team started working with Facebook engineers just over a year ago to understand their analytics platform and what visualization tools would fit. Aside from the key technical challenges of creating such a tool, it had to be “flexible and generalizable to the wide variety of models and datasets that companies like Facebook use for their many products and services” as well as be able to mesh into Facebook’s existing machine learning platform.
This platform is comprised of several different machine learning elements. At the core is Facebook’s unified ML platform called FBLearner Flow, which orchestrates the different machine learning workflows. The goal of Flow is to let their developers train models and see results without writing code.
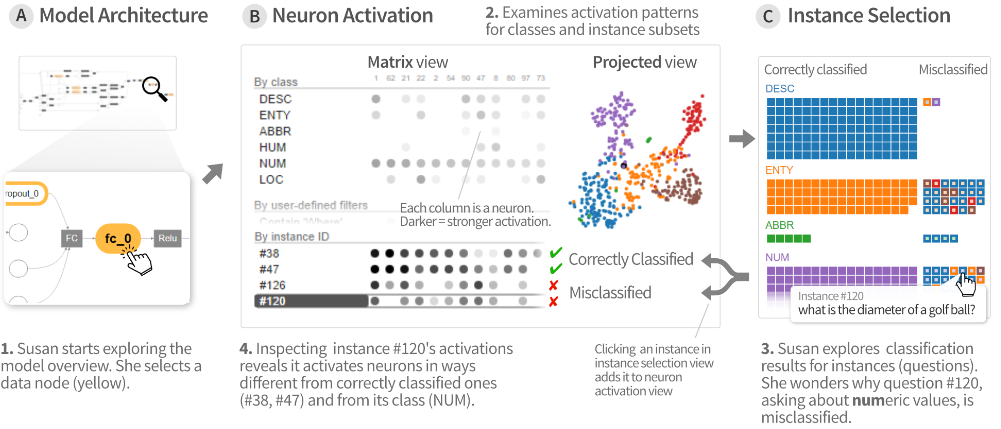
ActiVis supports both interpretation strategies for visualization and comparison of multiple instances and subsets. It unifies instance and subset-based inspections; it tightly integrates an overview of complex models and localized inspection and scales to a variety of industry-scale datasets and models—an invaluable tool inside Facebook for who want to use existing models for their data but not get into the nitty gritty of implementation. ActiVis is focused particularly on FBLearner Flow for visualization in part because of this user base.
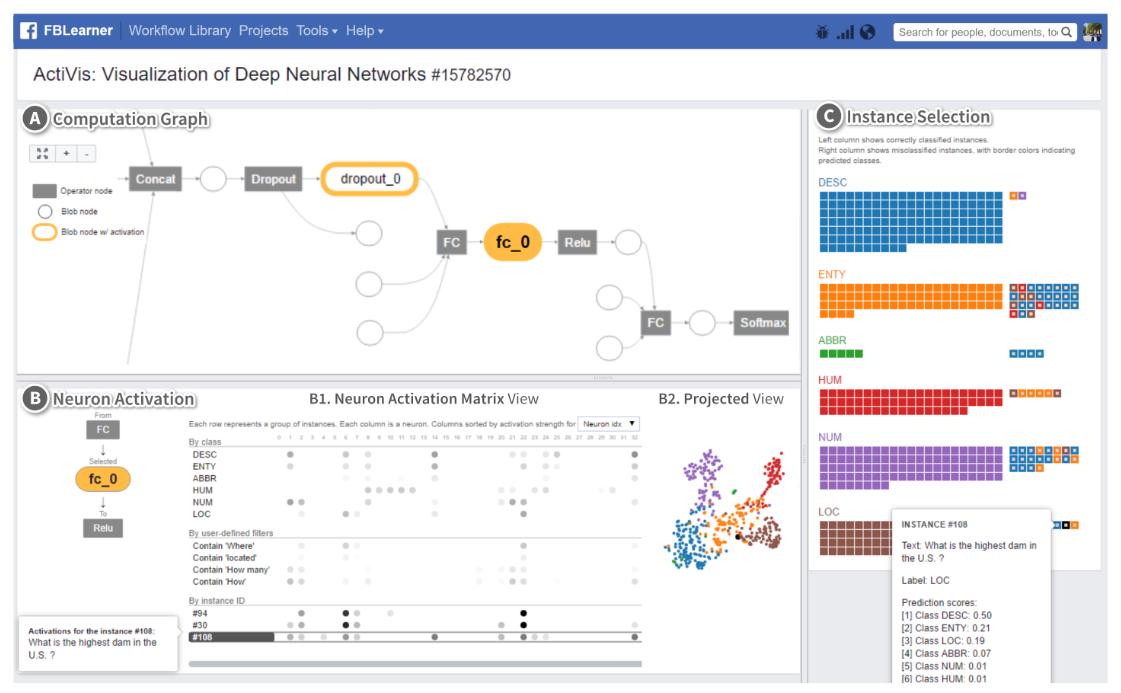
“ActiVis visualizes how neurons are activated by user-specified instances or instance subsets to help users understand how a model derives its predictions. Users can freely define subsets with raw data attributes, transformed features and output results, enabling model inspection from multiple angles.”
For anyone designing such a visualization system at scale, there are several elements that factor in creating a solid platform for neural network viz analysis, the Georgia Tech team says. They point to the diversity of input sources and data formats, high data volume, complex model architectures—and many of them. More technically are the needs for providing diverse subset definitions and instance-based and group-based analysis strategies.
“While many existing deep learning visualization tools support instance-based exploration, ActiVis is the first tool that simultaneously supports instance and subset-based exploration of the deep neural network models. In addition, to help users get a high-level overview of the model, it provides a graph-based representation of the model architecture, from which the user can drill down to perform localized inspection of activations at each model layer or node.”
The team says that Facebook developers who want to use the visualization tool add a few lines of code, which tells their models’ training process in the FBLearner Flow interface that it needs to generate the data needed for the visualization. At the conclusion of training, the interface provides a link to the web-based tool to visualize and explore the model.
“ActiVis is designed to work with many different models and datasets at Facebook,” the team says. “As complex models and large datasets are commonly used, it is important that ActiVis be scalable and flexible so engineers can easily adopt ActiVis for their models and users can visualize and explore them for their analytics tasks.”
As an end note, there is nothing new about visualization of neural networks to solve the black box problem, but as models grow more complex—aided by hardware and more data—the need for tools like these will be more important. We can expect to see open source and possibly commercial efforts for similar visualization tools hooked into key platforms, including TensorFlow, Caffe, and others over the next year and beyond for both production and scientific computing use (where this is needed to validate results).
The technical specifics of ActiVis can be found here.

Once Again, Meta Buys Rather Than Builds A Supercomputer
For a company that has been so enthusiastic about designing and building its own infrastructure and datacenters, Meta Platforms, the parent company to Facebook as well as WhatsApp and Instagram and one of the champions of the metaverse virtual reality a lot of us first read about in Burning Chrome, …
Getting Meta: Abstracting And Multisourcing The Network Like An FBOSS
If you want to build the world’s largest social network, with 2.9 billion users, and the massive PHP stack that makes it into an application, you need a lot of infrastructure and you need it to arrive predictably. Through its own supply chain management and the Open Compute Project ecosystem, …

ML Training Growing Pains at Facebook
Facebook has to keep digging into ever-lower levels of its architecture to make efficient use of endlessly growing training data. This has meant rethinking how ML training pipelines operate from ingestion to inference, sparking ideas about what system trends will dominate in industrial scale AI. From post ranking, content understanding, …
Be the first to comment