
As we have been saying for quite some time, when it comes to datacenter CPUs, we think that homegrown Arm processors (as well as those made by independents Ampere Computing and Huawei Technologies) will eventually represent at least half of the computing capacity that the hyperscalers and major cloud builders install. And by that logic, with these cloud titans representing about half of the CPU compute capacity installed in the world, that means Arm will soon attain a 25 percent share of worldwide datacenter CPU capacity.
This, of course, should be good news for Arm Ltd, the publicly traded infrastructure design company that is still majority owned by Japanese technology conglomerate and AI vendor wannabe SoftBank.
But here is the funny thing. No one outside of Arm knows just how much money the company is getting from the makers of CPUs, FPGAs, DPUs, switch ASICs and switch equipment, and various kinds of accelerators that are sold into the datacenter. These companies license Arm’s technology and pay royalties on the chips they have made by the foundries of the world so they do not have to start from scratch and build an ecosystem of their own.
This is the kind of thing we actually want to know at this point, and equally importantly, this is also what we think investors in Arm and customers of Arm probably also want to know. It is good, and amazing, that Arm has sold hundreds of billions of processors to the world with its eponymous architecture, but it status in the datacenter is distinct from its hegemony in smartphones, tablets, and embedded devices.
We want to know how Neoverse is doing, and if it is helping to cover its own research and development, which we presume is enormous, now that more and more hyperscalers and cloud builders are creating their own Arm server CPUs or buying them. And we want to know every quarter how Neoverse and related datacenter licensing and royalties are doing, too.
Ahead of Arm’s reemerging as a public company last year, we did see a pie chart from which we calculated that Arm’s “Cloud & Networking” customers drove 11.1 percent of its fiscal 2023 revenues, or $303 million out of $2.73 billion. (See Making Dollars And Sense Of Arm Holdings from February 2024 for our deep financial dive.) We presume this cloud and networking segment is larger for fiscal 2024 and will be even larger still when fiscal 2025 comes to a close in March of this year and, given the uptake of Arm servers among the hyperscalers and cloud builders, will be even still larger still in fiscal 2025. We also presume it is becoming a larger part of the overall Arm business, too. Note: That pie chart may have been for the share of royalty revenue, even though it did not say this explicitly. Our friends at Susquehanna Financial Group seem to think this is the case.
But oddly enough, no one even said the word “server” or “Neoverse” on the conference call that Arm held this week going over its financial results for the third quarter of fiscal 2024, a period that ended in March. There was some regurgitation of figures from the hyperscalers, such as chief executive officer Rene Haas pointing out that over the past two years, more than half of the new CPU capacity installed at Amazon Web Services was for Graviton server CPUs and that 900 out of the top 1,000 customers buying compute for rent on AWS using its EC2 service used at least some Graviton instances. There was some talk about using the ”Grace” Arm server CPU from Nvidia as part of the initial deployments for the Stargate Project being spearheaded by OpenAI as it tries to free itself from Microsoft Azure compute, and hints that future infrastructure would be based on other Arm CPUs.
Let’s go over the financials in some detail, and then let’s review some server CPU data that our friends at Wells Fargo have curated so we can start plotting out how Arm is doing in the datacenter a little bit better.
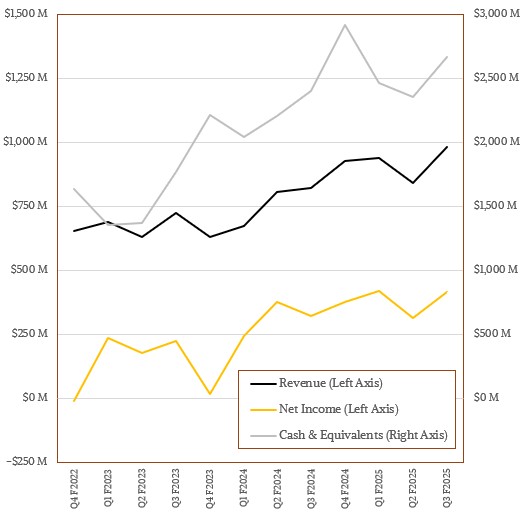
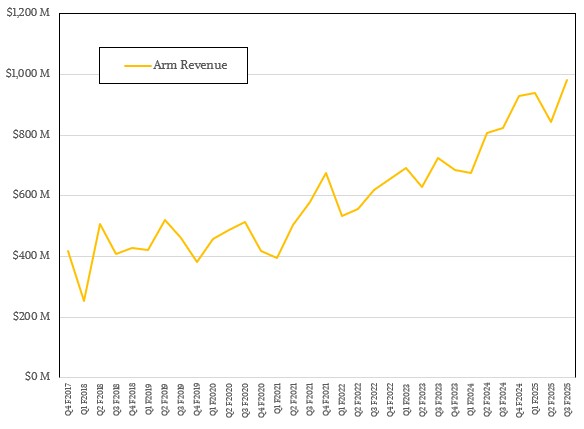
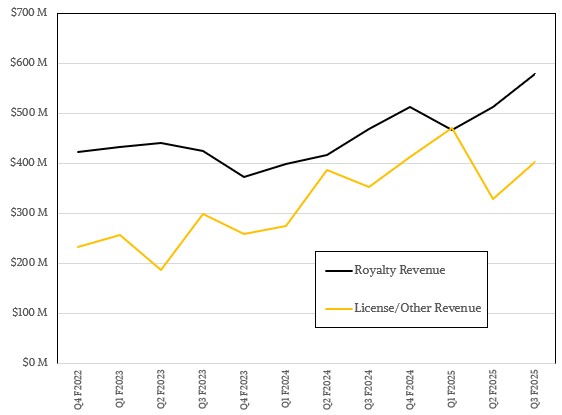
In the December quarter, Arm had $580 million in royalty revenue coming in from the chips that its partners sell, up 23.4 percent year on year and up 12.8 percent sequentially. Licensing and Other revenue, which is mostly licensing, rose by 13.8 percent to $403 million. Overall revenues were up 19.3 percent to $983 million.
Research and development costs represent the biggest line item at a technology licensing company like Arm – and there are very few companies like Arm in the world, mind you, but RISC-V upstart Tenstorrent is going to give it a whirl – and in fiscal Q3 hit $350 million, up 25 percent from the year ago period and represented 35.6 percent of overall revenues. Arm posted $442 million in operating income (up 22.4 percent), and $417 million of that fell to the bottom line as net income (up 28.7 percent). The company’s cash pile grew by 13.3 percent sequentially and 11.2 percent year on year to $2.67 billion.
There were 40 Arm Total Access licensees as the quarter cam to a close, up 48.1 percent, and 295 Arm Flexible Access licensees, up 35.3 percent, compared to the year ago period. Arm added one ATA licensee (roughly akin to what used to be called an “architecture license” in the past) during the quarter and 26 AFA licensees. Interestingly, Arm had a dozen Compute Sub System (CSS) licensees in fiscal Q3, up from eleven in fiscal Q2. We wish we knew how much money was coming in from these CSS deals.
What we can tell you is that Arm says CSS will drive somewhere in the middle single digits of total royalty revenue in fiscal 2025 and a double digit percentage in fiscal 2026. Further, about half of the CSS royalty stream is for “infrastructure” and half is from “client” devices.
According to the report from Susquehanna, the Infrastructure segment at Arm is now slightly over 10 percent of the royalty revenue mix. Networking accounts for half of the royalties in Infrastructure, and cloud (meaning hyperscalers and cloud builders) represents 35 percent of Infrastructure royalties.
We need to rectify all of this and try to get a better model. Obviously. It would be better if Arm actually just reported this data, of course.
In the meantime, we can get some insight from Arm and X86 server shipment data that has been compiled by Wells Fargo in its reports. This one plots out shipments of Intel Xeons, AMD Epycs, and all of the various Arm server chips from the first quarter of 2019 through the third quarter of 2024, with an estimate for the final quarter of 2024. (Data is not yet in for Q4 2024.)
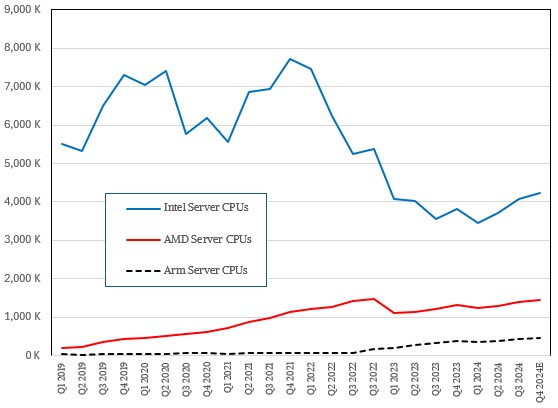
As you can see, shipments of Intel Xeon server CPUs have been falling since the second quarter of 2022, and that was in part due to the rise of successively better Epyc processors from AMD. But in the first quarter of 2023, something whacked AMD, too. Part of it, we think, was the GenAI-induced recession on general purpose server spending. Part of it was the rise of Arm among the hyperscalers and cloud builders.
This chart, which shows the rate of growth or decline in quarterly server shipments, makes this real obvious:
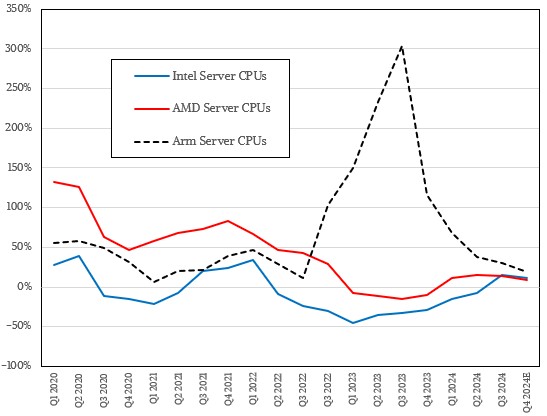
The rise of Arm in the tech titan datacenter has definitely put a dent in X86 shipments in 2023 and 2024. And as soon as the hyperscalers cooled their growth rate in Arm CPU deployments and enterprises as well as the hyperscalers and cloud builders needed to update their aging X86 server fleets, even Intel managed some growth.
We need to get a handle on what these Arm server CPUs cost and how that translates into lower prices for server instances. Assuming the lower charge for rental on a cloud is proportional to the lower cost for a unit of compute, then hyperscalers and cloud builders can get three Arm CPUs for about the same cost as they would pay for two X86 processors. We think that it is actually more like half the cost for an Arm server CPU to be manufactured than what an X86 server CPU costs at high volume, and then some of that savings has to be pumped into CPU development and that’s how you get the 30 percent to 40 percent better price/performance on an Arm instance versus an X86 instance.
No matter how we arrive at that math, this overhead is a lot to pay Intel or AMD, which is why Arm licensing and royalties are going up in the datacenter – and are going to go higher in the coming years. But if Arm increases its licensing and royalty fees too much, all of the “control of our own fate” sounds a whole lot less attractive. And should Arm be tempted to raise those licensing and royalty fees too high, it will foster the RISC-V revolution it so earnestly wants to avoid.
The hyperscalers can port their own code to any architecture, but cloud builders (many of whom are also hyperscalers) still need to buy X86 server CPUs to run a mountain of legacy Windows Server and Linux code that millions of enterprise customers are running in the cloud. And they can – and will – absolutely charge a premium to do so, a fact that Intel and AMD also know.
Everybody knows exactly what’s going on in this regard. Our question is will the datacenter business rake in the billions for Arm?

One On One With Jensen Huang: Nvidia, The Platform Company
While a lot of ideas are ancient, some are relatively new and can come from only a modern context. Platform is one such concept, and given what we care about here at The Next Platform, it bears some analysis as we consider the company the Jensen Huang, co-founder and chief …
The Big Clouds Get First Dibs On AMD “Genoa” Chips
The expanded lineup of AMD’s 4th generation “Genoa” Epyc server chips – built atop “Zen 4” core and some with the chip maker’s L3-boosting 3D V-Cache – unveiled at a high-profile event in San Francisco this week is quickly making its way into the cloud. Microsoft and Amazon Web Services both …

The Slow But Tectonic Shifts In Datacenter Infrastructure
One of the more interesting trends in infrastructure that we try to get a handle on every once in a while is how much of the server and storage capacity is being deployed in bare metal, standalone fashion and how much is being sold to run utility style, cloud environments. …
I can offer Xeon annual volume on a quick take this can be precisely refined but good enough for this purpose. Quantities are DCG annual revenue / $1K AWP / 2 = 50% gross but I counsel to estimate on Intel net as the actual volume covering all costs.
2009 = 8,430,480 units
2010 = 8,192,133
2011 = 9,633,624
2012 = 12,074,929
2013 = 16,564,177
2014 = 20,040,284
2015 = 22,218,597
2016 = 22,256,694
2017 = 16,757,767
2018 = 20,179,510
2019 = 19,353,829
2020 = 19,271,472
2021 = 20,645,936
2022 = 17,454,704
2023 = 7,365,170
2024 = 6,090,283 shows a drop of < 72.7% since the 2015 peak
Total at $1K / 2 = 229,906,977
The average over 16 years = 14,369,186
2014 to 2020 reveals commercial analysts so said 20 million-ish annual that is low on channel supply data.
I can provide quarters on INTC 10Q revenue / $10K net take covering all costs.
2021
q1 = 6,758,621
q2 = 7,844,828
q3 = 10,216,112
q4 = 7,475,263
Total = 32,294,824
2022
q1 = 8,596,001
q2 = 5.743,041
q3 = 7,223,821
q4 = 8,078,880
Total = 29,641,743
2023
q1 = 12.922,052
q2 = 9,163,317
q3 = 5,819,748
q4 = 9,149,137
Total = 37,054,254
2024
q1 = 2,041,978
q2 = 5,546,861
q3 = 1,578,688
q4 = 4,578,199
Total = 11,703,748
Total over 5 YEARS = 112,736,546
Average / qty = 7,046,034
But this is the actual volume of Xeon on channel supply data revealing bundle deal, wholesale trade exchange, country extort tariffs and black market banking system also known as DCG product laundering theft,
v2 = 1,205,691,518 and this is why Intel is financially stressed
v3 = 2,191,476,094 on the marginal cost loss of revenue units
v4 = 1,102,124,406 relied as product bribe on their exchange value
SL = 614,079,144 albeit on social welfare cemented Xeon share position
CL = 207,664,808
IL = 13, 233,675 on refined estimate
SR = 8,483,125 on refined estimate
ER = 670,578
SF+GR preliminary samples = 189,652 to 369,961
All up 5,343,793,309 processors or 296,877,406 racks x 18 CPU
AMD and ARM, and Intel are well aware of the concealed installed base volume.
That volume 5.343 Billion units is the basis for server plus accelerator TAM replacement.
AMD Epyc volume on net
2018
q1 = 117,211 units
q2 = 357,003
q3 = 445,297
q4 = 178,426
Total = 1,097,937
2019
q1 = 148,784
q2 = 766,115
q3 = 137,346
q4 = 310,640
Total = 1,362,885
2020
q1 = 441,392
q2 = 670,731
q3 = 1,073,170
q4 = 1,287,904
Total = 3,473,097
2021
q1 = 1,099,499
q2 = 4,331,103
q3 = 132,053
q4 = 1,216,446
Total = 6,689,101
2022
q1 = 1,778,617
q2 = 1,115,733
q3 = 1,907,968
q4 = 1,905,720
Total = 6,708,038
2023
q1 = 1,065,892
q2 = 1,014,577
q3 = 1,963,303
q4 = 2,446,491
Total = 6,490,264
2024
q1 = 1,521,269
q2 = 3,632,082
q3 = 1,365,593
q4 = 818,425
Total = 7,337,370
AMD 7 Year Epyc Total = 33,158,691
Average over 7 years = 4,736,956
AMD production share over 7 years = 15%
Intel production share over 7 years = 85%
AMD production share in 2024 = 38.5%
Intel production share in 2024 = 61.5%
My AMD full year 2024 will be posted at my seeking Alpha comment spot shortly
Mike Bruzzone, Camp Marketing
“11.1 percent of its fiscal 2023 revenues, or $303 million out of $1.56 billion”
Did I misunderstand that but 11.1% of $1.56 billion is $173 million, not $303 million?
Nope. I just typed the wrong number. Apologies. It was supposed to be $2.73 billion.