

There are so many annual rites in the IT sector that it almost has the feel of a religion sometimes. There is the predictable cadence of trade shows and conferences as well as the rhythm of market research and analysis that comes out like clockwork. As each year ends, the first thing everybody wants to know is how it turned out, and the second thing they want to know is what to expect from the coming year.
Gauging the flows in the mind-numbing collection of revenue streams that comprise the global IT sector is no easy task, and aside from that, currency exchange effects distort the numbers as sales in local currencies around the globe are converted to US dollars so annual comparisons can be made more broadly across time. To be fair, a lot of the largest commercial IT suppliers are based in the United States, and so this seems natural enough, but it is helpful to remember sometimes that while the US may be the largest buyer of hardware, software, and services, it probably only accounts for about a third of the pie, depending on how you want to slice it.
This time every year, the analysts at Gartner take a stab at figuring out how last year went before most of the IT suppliers have reported their final quarter for that year, and they also venture an educated guess, based on macroeconomic conditions and trends in the industry, about how the coming year might turn out. It is a kind of sentiment analysis, and given the uncertainty in China – and therefore, the world – and in the stock markets – and therefore, the broader economy – we could use a little good news.
The IT spending in 2015 from Gartner, and the forecast for 2016, both look pretty good at first blush, considering how the strengthening US dollar has made overseas sales look weaker than they actually are. But as we look at these numbers, we can’t help but contemplate the vast amount of activity and investment in the IT community that is not in these numbers. We have no idea how to estimate this unseen “revenue,” if you want to call it that, but we just wanted to point out that it is there.
But first, let’s look at the spending that Gartner has provided in broad terms over the past four years plus its forecast for 2016. Gartner has been breaking down IT spending – meaning spending by organizations like companies, governments, educational institutions and the like, not individuals – into five major segments for the past several years. These include datacenter systems, which are the servers, storage, and networking gear that drives computing, as well as enterprise software, IT services, telecom services, and client devices of various kinds, including PCs, tablets, and smartphones. Take a look at the data we have compiled from several previous Gartner reports over the years:
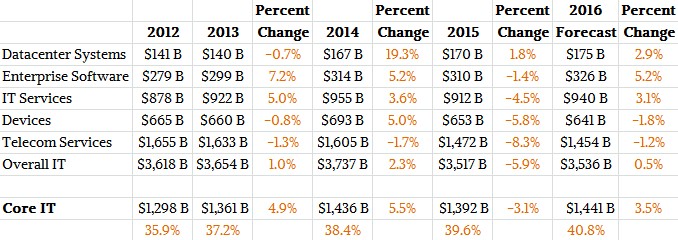
There are a few interesting things to note here. First, datacenter systems spending jumped quite a bit in 2014 if Gartner’s numbers are right, which is a bit astounding given the relatively modest growth that most of the big IT vendors turned in, and it looks like growth continued at a more modest level in 2015 and is expected to continue into 2016, too. Datacenter systems spending was stuck in the mud at around $140 billion globally for many years, but took a big jump in 2014 as the world’s largest hyperscalers and cloud radically increased capacity and then a whole new wave of cloud builders – the next 10,000 as Intel calls them – started their transition from bare metal or virtualized systems to fully automated clouds.
In its presentation of the 2015 figures and 2016 forecast, Gartner said that there are some mitigating factors in the rosy forecast it is presenting for the year ahead. Currency effects pushed down revenues across the IT sector last year, with the overall market dropping 5.8 percent to $3.52 trillion across all of hardware, software, services, and telecom expenditures. Datacenter Systems was, at least among the broad categories of spending, a relative bright spot, with 1.8 percent growth to $170 billion. Gartner says that the hyperscaler segment has had higher and more steady demand in 2015 than anticipated, rather than the more normal choppiness that OEMs and ODMs have come to expect from these elite customers, and moreover that this high level of investment in servers (and that also means storage servers and network function servers, too) will continue on into 2016.
Spending on enterprise software is expected to accelerate again this year thanks to the currency reversal as the US dollar weakens and actual spending rises a bit, by 5.2 percent to $326 billion by Gartner’s crystal ball. IT services, a hodge podge of everything from custom programming to cloud services to systems integration to product support, will also see a rise.
There are many things that are not evident in these numbers, as useful as they may be in helping us all try to reckon what the year ahead might hold. Forecasts for unemployment and inflation as well as expected IT spending levels do play a big part in budgets at many organizations, although their own particular situation and business objectives should prevail over what is happening in the global economy at large. We all have to deal with the macroeconomic issues eventually.
The first thing that is not immediately obvious from these broad numbers is that the core datacenter IT business – systems, services, and software – is either growing faster or declining slower than the overall IT market that includes devices and telecom services that link the devices to the systems and people to each other – and systems to each other over wide area networks – during their workday. We have shown this as Core IT in the table above. Moreover, you can see that this part of the market is therefore growing as a share of the overall IT segment, attesting to increasing investment even when currency effects push the reported revenues down.
The other funny thing to note is that companies are radically cutting back on their telecom services, and it looks like this dough is being plowed back into investments into infrastructure. Whether that is intentional or not is unclear.
The big thing that is missing from this data – and which would be very hard for Gartner or any other market researcher to add back in – is the value of all of the homegrown and open source software that is used in real IT operations. Such software may be free, but companies are nonetheless paying experts to tweak it and manage it for various data analytics workloads. The largest organizations in the world have enough experts on open source projects that the idea of paying for commercial support to a vendor behind the open source project is untenable. (If you ask some of the Fortune 500 why they don’t pay for commercial support on open source software, they actually laugh and often mutter something about being burned by proprietary software in the past.) While there is still a lot of proprietary software out there, and many organizations are paying for licenses and support for it, the investments that they make in creating and maintaining their own software stacks is not in the numbers. How do you value the 1 trillion lines of COBOL code still running on the 6,000 or so IBM mainframes, or the 2 billion lines of code that Google maintains?
The same holds true, to a much lesser extent, for the value of the engineering work that companies do for their own servers, storage, and networking gear. If revenue is really a measure of the work that a product maker did on your behalf, then work you do on your own behalf is part of the IT ecosystem, too. We have no idea how you might reckon this value with any accuracy, but we do know it is a non-zero value that is significant – and probably increasingly significant – for many organizations.

Cloud Spending Curtailed, On Premises Spending Heading Into Recession
The central bankers of the world want to curb inflation by putting a serious crimp in demand, and it looks like they may get what they want – sort of – in 2023 when it comes to datacenter infrastructure. The latest forecasts out of market researcher IDC certainly back up …
IDC Boosts Datacenter Compute And Storage Spending Forecast
When you have to compile the revenue streams of thousands of major IT hardware, software, and services suppliers into the datacenter, it takes a bit of time to get that data, get it right, and then aggregate it for a datacenter market analysis. Which is why, here at the beginning …

Hybrid Cloud Should Benefit You, Not Bezos
We have always been convinced, and remain so, that there is no way that the largest organizations in the world will move their computing to one of the big cloud builders. And ten years ago, when Amazon Web Services was still relatively small and yet growing fast enough to scare …
Be the first to comment