
If The Next Platform is about anything, it is about chronicling the tectonic changes that affect the IT landscape. Ditto for the prior decades of work by the co-editors before the launch of this publication nearly seven years ago.
We have been watching the cloud change the distribution and consumption models for hardware and software since the late 20th century and are not surprised to see a return to the utility computing model that dominated the early mainframe era. It was inevitable because IT systems took too long to deploy (as much for budgetary reasons as for technical ones), were too brittle, and were not geographically distributed and resilient.
We now take these things as a matter of course, thanks to the rise of the public clouds. Which, to be quite honest, are more like proprietary clouds controlled by a new breed of public utilities – albeit unregulated ones. Like many people, we have used the term public cloud to differentiate between private cloud installations – meaning on premises gear that companies install and manage like public clouds, with their server virtualization and now container layers and utility style pricing – and those owned by and run by Amazon Web Services, Microsoft Azure, Google Cloud, Alibaba Cloud, Baidu, and Tencent Cloud. As we were reminded last week by one commenter in The Many Other High Costs Cloud Users Pay, these are not really public clouds, which implies a certain amount of governmental oversight and pricing and usage. These are the real private and proprietary clouds.
The term cloud has always been stupid, too. But we won’t get into that trap as we ponder some new market statistics coming out of IDC that tries to better characterize the transition to cloud from traditional host computing. IDC has launched a new Worldwide Quarterly Enterprise Infrastructure tracker that brings together revenues for servers and storage for systems, eliminating some of the double-counting that was done in its independent server and storage trackers, as well as breaking the market down into infrastructure that is cloud and shared, cloud and dedicated, and non-cloud and dedicated. In the past, we might have called these public cloud, hosted, and on-premises and traditional IT systems. But there are nuances of differences. Non-cloud and dedicated systems can be on premises or in a co-location facility, for instance. Cloud and dedicated can be an AWS Outpost, a Microsoft Azure Stack, or a Google Anthos cluster running at your site. So this new way of thinking is removing the where of the compute and storage and focusing on the how of compute and storage.
Also, the new tracker from IDC is concerned with the spending by the organizations that build this infrastructure, and doesn’t differentiate from corporate, government, or public cloud spending. This is not a measure of the value of what the public clouds sell, but the investment that public clouds make. And this data is presented by vendor, which is useful, and also has a forecast running from 2019 through 2025, which is also useful.
The thing we find surprising about spending on compute and storage is the persistence of non-cloud and dedicated systems – meaning monolithic things you buy or lease every three, four, or five years, sometimes every five or six years for certain kinds of proprietary systems like IBM mainframes and Power Systems machinery. This stuff has just stuck around despite all of the obvious benefits of utility-style computing. If you go back to the older IDC dataset, non-cloud IT infrastructure spending back in 2014 came to an average of $15.1 billion per quarter, and it trended down a bit in 2015 through 2017, but thanks to the System z14 mainframe and the Power9 server cycles starting in 2018, actually trended up a bit in 2018 through 2020. IDC did not put out data for Q4 2020 under its old model, but in the first three quarters of 2020, non-cloud, traditional IT spending it was back down to an average of $14.9 billion per quarter.
If you do the math, the non-cloud and dedicated portion of the market was around 74 percent in early 2014 when IDC first started carving up the IT infrastructure market sort of this way, and in 2019 it was still at 51.6 percent of the total. Just barely dominant. And thanks to the coronavirus pandemic last year, that share has slipped well below half of spending and looks like it will keep going that way until about 2033 or 2034, when it should disappear completely based on current trends. Here is the forecast out to 2025:
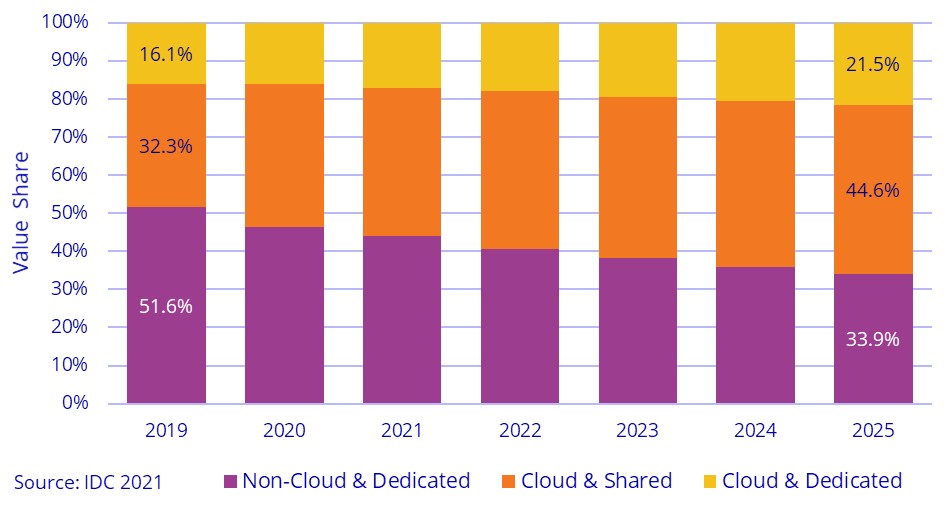
That is a big change from 2014 through 2025, with non-cloud and dedicated infrastructure falling from three-quarters to a third of spending, and that is with the overall IT infrastructure market steadily growing from $82.4 billion in 2014 to $112.9 billion in 2025. Even at a 33.9 percent share, that non-cloud and dedicated portion of the server/storage revenues to the makers of this gear will still represent $38.7 billion in sales. That works out to a compound annual decline rate of just under 4 percent a year compared to an overall market that has a compound annual growth rate of 2.9 percent.
There’s a joke about a pig that saves the entire family at its farm from a house fire, and when asked if the pig lost the leg saving the family, the farmer replies. “Oh no, but a pig that special, well you can’t kill it all at once.”
So it is with monolithic systems running trillions of lines of code that underpin the global economy today, and will still have a significant presence in the coming decade. In 2034, mark my words, there will be plenty of COBOL mainframe code still running in the world – even if IBM stops making System z iron. The vast majority of mainframe customers don’t need more scalability as much as they need better price/performance, which is given to them with every architectural leap. That’s why most shops move ahead. But each move nets less money per unit of performance, and hence the revenues keep drifting down as the customer base dwindles a little but the aggregate compute in the IBM mainframe base, believe it or not, is still going up at an absolutely steady freddie pace. This is how it works.
As you can see in the chart above, IDC expects that cloud and shared architecture – what we would call the public cloud, will become the dominant place where servers and storage are sold in 2022 and keep growing from there. This model no doubt assumes that people keep not doing the math on cloud costs, or that public cloud vendors charge a lot less of a premium for their product (or add in services that justify it, including applications themselves) and hence they will, as a group, represent the bulk of IT spending for servers and storage. It is always important to remember that this is not the price of servers and storage that end users pay on the cloud, but the price the cloud vendors pay. So this is all apples to apples from the point of view of the vendors, but from the point of view of the users, we really need to compare the quarterly revenue streams from installed servers and storage to the aggregate spending each quarter for cloud infrastructure services. And if you really want to get picky, you need to amortize server and storage revenues over time and compare it to cloud revenues for servers and storage over time.
Let’s use the data we have, just the same.
The table below from IDC is very interesting, for instance. It shows the top eight server and storage infrastructure vendors, commonly called original equipment manufacturers or OEMs, plus the original design manufacturers, or ODMs, who help design and make servers for the hyperscalers and cloud builders, plus the rest of the OEM market.
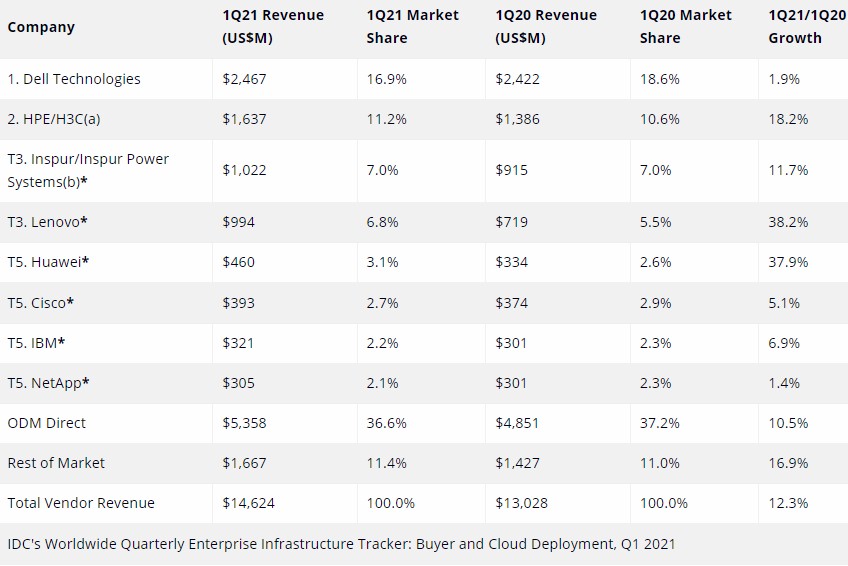
This is for cloud infrastructure only, which means both cloud and shared – what we should start calling cloud utility or just utility compute and storage – and cloud and dedicated – which means on-premises managed and owned by the cloud builders as well as the utility-style pricing for Hewlett Packard GreenLake or Dell APEX, for instance. We think that these utility-style pricing options from the OEMs could absolutely be competitive and done in co-location facilities for a competitive price, providing cloud-like pricing and feel without the high price of cloud, as we talked about here.
It seems a bit unfair that the H3C sales are included with HPE’s numbers but the sales of Power-based machinery at Inspur Power Systems is not counted in IBM’s numbers. We suspect that Inspur accounts for about a third of Power-based server sales worldwide now, and that is material. Most of the revenues above for cloud infrastructure are for Power-based gear.
The top players in this market – the top eight OEMs and the top eight ODMs – have crowded out everyone else from this cloud infrastructure market. That’s the first thing to notice about the table above. And the hold these companies have is getting tighter, not looser. The other thing you will note is that everyone is growing, even IBM and NetApp. You do not usually see that, either, in a datacenter server or storage or switching market in total. Lenovo and Huawei Technology are growing three times faster than the market, and HPE/H3C is growing at one and a half times the market and, in fact, represent a lot of the growth. Inspur is essentially at market rate and the ODMs are a little slower than the market overall.
We look forward to seeing how this data changes over time and learning from it.


Lenovo Teams With Microsoft Azure At The Edge
In the ever-evolving landscape that is the edge, applications are the driving force. The Internet of Things (IoT) and the billions of connected devices and systems that make it up are giving the edge structure, and the massive amounts of data that those systems and devices are generating are the …

Designing Servers In Rapidly Changing Times
When chip makers launch the latest additions of their datacenter processors, server OEMs have historically immediately or soon after followed with a rollout of the latest new or enhanced systems based on those offerings. Then they’d wait until the next big unveiling by another chip maker, and the process starts …
Ethernet Switching Bucks The Server Recession Trend
You might be thinking that with all of the investment in AI systems these days that the boom in InfiniBand interconnect sales would be eating into sales of high-end Ethernet interconnects in the datacenter. This is not the case. According to the latest market research from IDC, there is enough …
Be the first to comment