

The things we like best about watching the high end of the IT sector are seeing new technologies come out that have the potential to change the IT landscape and then seeing some market data that proves a technology either did or did not foment the expected change. The analysts at IDC have given the world a peek at a relatively new dataset that quantifies global spending on cloudy infrastructure – the real cloud, meaning the one that you can only buy as a utility, not install on premises – and we thought we would walk you through it.
There are many layers to the public cloud, as everyone knows by now. There is infrastructure as a service, or IaaS, which is when companies buy compute instances and storage and networking services to connect them all together. Higher up in the abstraction, there is platform as a service, or PaaS, where the underlying compute, storage, and networking is hidden from users, who see an API, an application runtime, and a data service and that is about it. And then there is software as a service, or SaaS, which is just an online application and it looks like something running locally but it isn’t – it is rented as a service on the cloud. IDC introduced a nuanced subcategory of SaaS, separating out applications that are rented from other kinds of systems software that is rented and that lies somewhere between IaaS and SaaS and off to the side from PaaS (or perhaps underneath it, depending on how you want to draw the block diagram).
As you might expect, there is a bit of consolidation going on amidst the explosive growth of the cloud market, and we are not yet seeing the kind of market share levels among vendors that happens in, say, the server or external storage or datacenter networking spaces. The most recent data that IDC has for spending on worldwide public cloud services is for 2020, and the company is at the moment doing a semi-annual update. Over time, as more data becomes available and IDC’s model matures, we expected that it will have a quarterly tracker as it does for servers, storage, networking, PCs, and other areas. In any event, the top five vendors in the public cloud – Amazon Web Services, Microsoft, Salesforce, Google, and Oracle – captured a total of 38 percent of the $312.4 billion in cloud spending across all types, and collectively grew at 32 percent from 2019’s levels. Microsoft and AWS are tied at this point with 12.8 percent of the total market each. This is something we said six years ago we expected as we launched The Next Platform because of the vast base of applications that Microsoft sells in datacenter and that can be relatively easily shifted to the Azure public cloud as well as adjunct services that can be used with on premises Windows Server stacks.
IDC never presents its full data set to the public in its market trackers, but we have compiled up what it has presented in the past two years as well as a vendor chart it put together for its 2020 data, and then created tables and charts from this to show some trends.
Here is the raw data from 2018 through 2020, inclusive, that shows public cloud services spending by type:
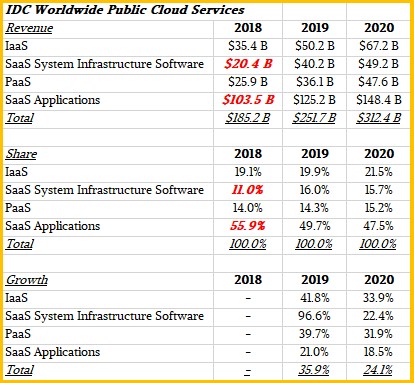
In early 2020, when IDC talked about public cloud spending in 2018 and 2019, it did not have the System Infrastructure SaaS category, so we have estimated and backcast the 2018 data, which is shown in the bold red italics above.
As you can see, SaaS – both application software and system infrastructure software – has been slowing over the past three years, which growth rates for IaaS and PaaS have been creeping up. IDC expects this to continue. But as you can also see, the pace of growth for the overall public cloud services market has slowed, growing 35.9 percent across all categories to $251.7 billion in 2019 and growing 24.1 percent to $312.4 billion in 2020. The question now is how long before the growth in spending on public clouds slows down to meet the growth rate of global gross domestic product. Our guess is that this might take at least a decade. A recession and some competition could radically increase the move from on premises datacenters to the public cloud. It’s really hard to say, though, which is why most models for spending in the future end up going up and to the right at a steady clip. Based on the three years of data we have seen, this would be valid – right up until the moment it is not.
Here is a column chart that shows revenues by year for the four categories of public cloud services:
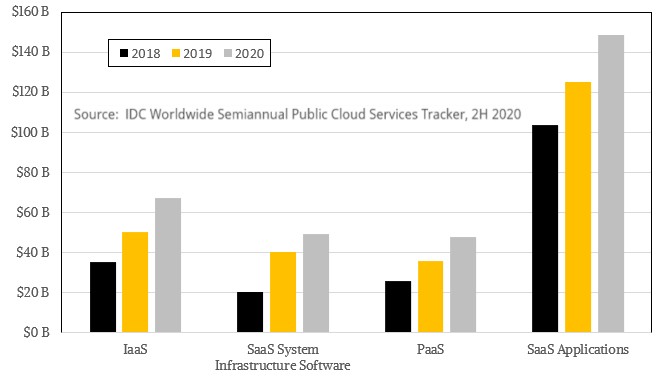
You can see the different revenue and growth rates by public cloud services type better in the chart above.
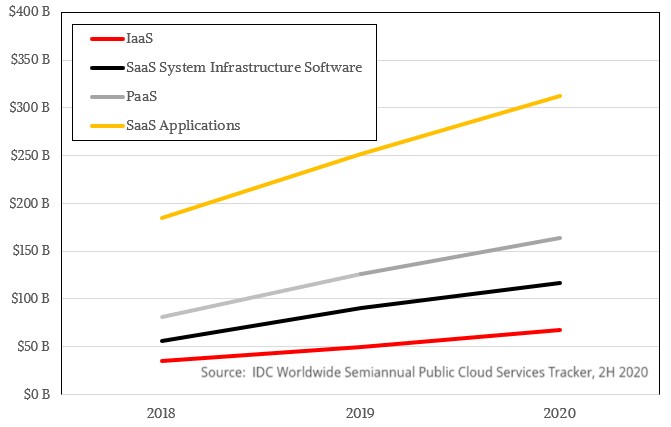
The chart below shows the same data as a line chart over the three years, which makes it easier to compare relative growth rates over time across public cloud spending type:
IDC separated out SaaS spending from IaaS, SISaaS, and PaaS spending and put this chart for 2020 spending by vendor into its statement accompanying the numbers, which is very useful indeed:
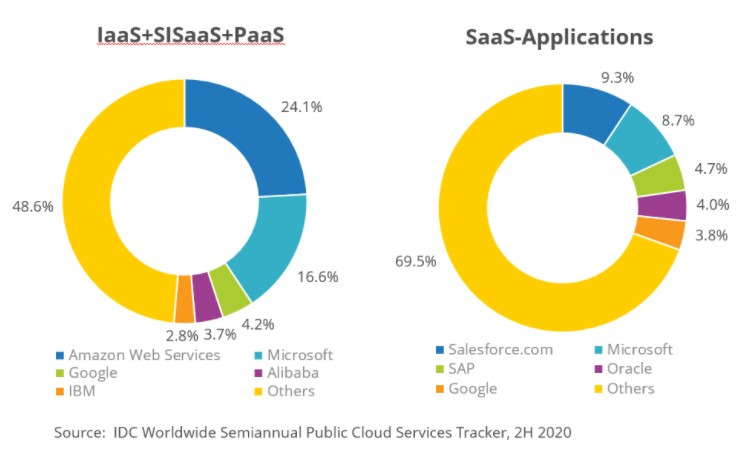
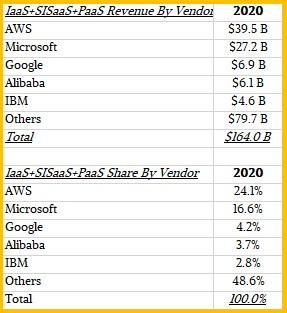
For those of you who want to know the numbers, we worked the math backwards to convert market share pie slices back to revenues in billions of dollars for 2020 by vendor and whether it was SaaS application or the combination of IaaS, SISaaS, and PaaS. Here is the IaaS+SISaaS+PaaS vendor table:
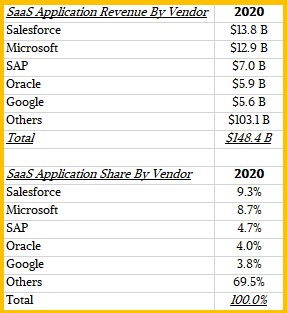
And here is the vendor breakdown for 2020 for SaaS application software vendors:
AWS has not yet built up a top five SaaS business yet, but we are confident it will at the same time Microsoft will keep building up its cloud infrastructure business and grow its already substantial SaaS business. The game is a-foot between these two. It will take Google, Alibaba, IBM, Oracle, and others a long, long time to catch up to these two. Like, oh, say, never. If anyone has a shot to be a third big player, it is probably Google, particularly with IBM so gung-ho about hybrid cloud in the wake of its Red Hat acquisition. We think there will be plenty of niche cloud players for a long, long time, serving specific industry or geographical needs, just as there were server, storage, and switching OEMs who did the same for decades before the cloud emerged as an alternate IT infrastructure delivery model after decades of false starts. It is going to be a long, long time before any vendor has anything close to dominant market share in the public cloud – and that may be a never as well.
We look forward to watching this dataset fill out and evolve over the years. Crunch!

Anthropic Raises 285 Million GPU-Hours Equivalent In Series E Funding
Rather than measure the funding rounds and valuations of AI startups building foundation models in US dollars, perhaps we should just convert that right into GPU-hours rented to train models, since this accounts for the vast majority of spending that OpenAI, Anthropic, and a handful of others do in their …
Amazon Will Spend Nearly A Year Of AWS Revenue On AI Investments
There is a bit of AI spending one-upmanship going on among the hyperscalers and cloud builders – and now the foundation model builders who are partnering with their new sugar daddies to be able to afford to build vast AI accelerator estates to push the state of the art in …

Vertically Unchallenged
Components make compute and storage servers, and servers with application plane, control plane, and data plane software running atop them or alongside them make systems, and workflows across systems make platforms. The end state goal of any system architect is really creating a platform. If you don’t have an integrated …
Be the first to comment