

It had to happen sooner or later, and really, the wonder is that it hasn’t already happened, given the nature of the infrastructure buildouts at hyperscalers and cloud builders, the skittishness of enterprises due to the trade war between the United States and China, the uncertainty in Europe over the British exit, and general concern with macroeconomic issues because it has now been almost twelve years since the last recession. Falling prices for DRAM memory, flash memory, and GPU accelerators were also contributing factors.
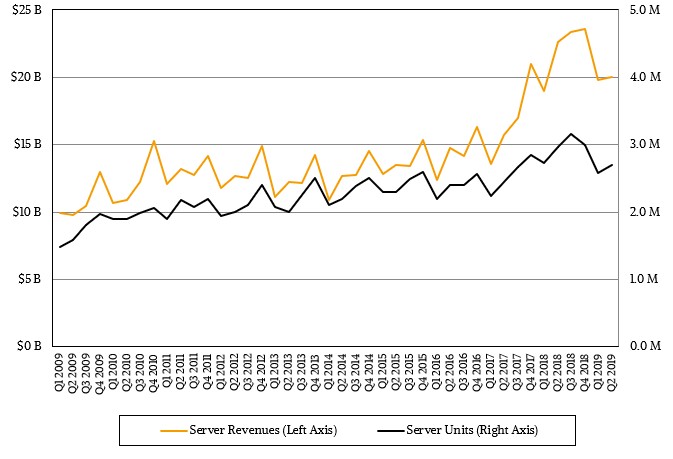
We are talking, of course, about a downturn in server spending, which we feel is one of the key economic indicators given the foundational nature of data processing in the 21st century. We have been on a hell of a run since 2016 in terms of server shipments and sales, and while growth has been slowing in recent quarters, both metrics went into negative territory in the second quarter of 2019.
According to the latest statistics from the box counters at IDC, server revenues worldwide fell by 11.6 percent to just a hair over $20 billion in the period ended in June, and shipments fell by 9.3 percent to 2.97 million units.
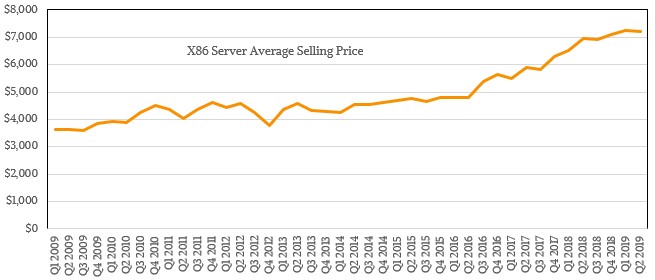
That means average selling prices actually came down a bit, and you can thank competition from AMD in the X86 processor space and falling DRAM and flash prices for that. ASPs came down only six-tenths of a point between Q1 and Q2 of this year to $7,194 per machine across all X86 iron, but among the ODMs, which are doing mostly X86 iron as well, that sequential drop in ASP was 10.7 percent. It looks to us like the hyperscalers and cloud builders are getting the benefits of the DRAM and flash price drop passthrough and maybe the enterprise shops are not seeing very much of it.
This may not seem fair, but you can hardly expect different behavior on the part of the OEMs and ODMs or those that operate as either kind of manufacturer of systems.
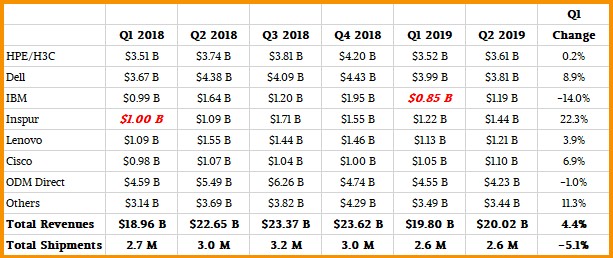
Interestingly, shipments by the original design manufacturers, or ODMs, that primarily make machinery for the hyperscalers and cloud builders, took an even bigger hit on the revenue front even though shipments were not hit so hard. Across the major ODMs, IDC reckons shipments fell by 7.3 percent to 678,940 machines in Q2 2019, and revenues fell twice as fast as the drop in the market overall, down 22.9 percent to $4.23 billion. If you take the ODMs out of the picture, the rest of the OEM server makers had an 8 percent decline to $15.8 billion.
But ODMs are not the only companies selling to hyperscalers and cloud builders, so you have to be careful with that correlation. Dell sells plenty of iron to a few hyperscalers. (Microsoft and Tencent are its biggest customers.) Hewlett Packard Enterprise, through its H3C partnership in China, still sells gear to these big Internet firms in the Middle Kingdom, and HPE has sales of minimalist Cloudline machines to companies like eBay, which are certainly on the low-end of hyperscale. Inspur and Lenovo do plenty of business with the hyperscalers and cloud builders in China, and Inspur in particular is growing fast – and not just because of its X86 server business, but also because Inspur sells machines based on IBM’s Power8 and Power9 processors to a market that Big Blue has basically ceded to Inspur much as HPE has ceded to H3C. We estimate that if IBM is doing around $2.5 billion in Power Systems sales a year, then the rest of the OpenPower ecosystem is doing around $500 million, and the bulk of that is now being done by Inspur.
This is the only way to do business in China for American companies right now. And it doesn’t really help the topline all that much.
While the hyperscalers and cloud builders have experienced periods of explosive revenue growth, and continue to grow much faster than just about all other publicly traded companies, there is no question that their sales are, both individually and as a group, slowing. Here’s a chart, compliments of the wonderful site Macrotrends, that shows the trailing twelve months revenue for Amazon, Google, Facebook, Alibaba, and Baidu, which covers five of the big eight hyperscalers:
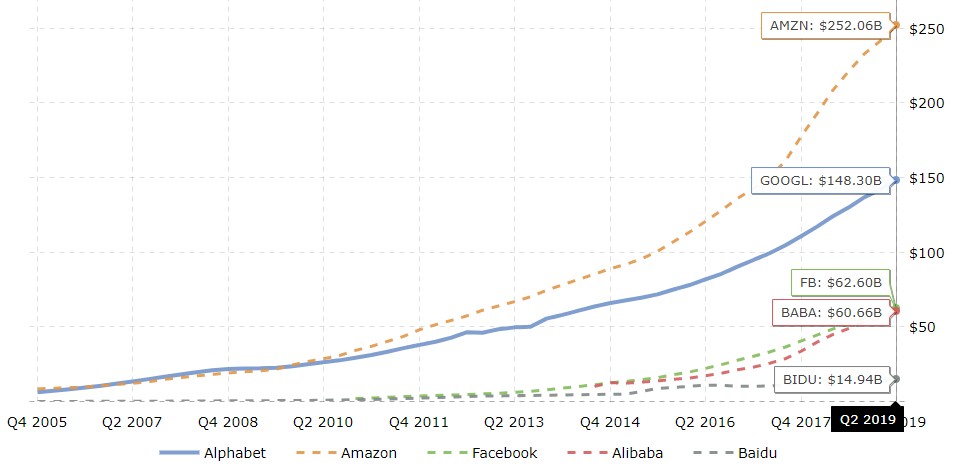
This is a representative sample, we think, and we purposefully left Microsoft, one of the Great Eight, out of the mix because so much of its revenue is driven by software not its infrastructure. And we understand that the trailing twelve month figures tend to even out the quarterly ups and downs a bit so you can see a more general trend, but that also fills in the potholes and levels out the hills that might portend some big change. Or not. You can only tell in hindsight, really.
This chart above does not break Amazon Web Services free from its retailing parent, but since 2016 growth for AWS has been sliding from near 70 percent quarter on quarter down to 37 percent in Q2 2019. Google has been growing at between 20 percent and 25 percent quarter on quarter since 2016 began, with below normal 16.7 percent growth in Q1 2019; the search engine giant and ad and video server has long since left its high growth phase. Facebook revenue has followed a similar path. The social network was doubling sales quarter on quarter back in 2011, and that dropped by two-thirds in 2012 and 2013, spiked back up to over 70 percent growth in 2014, was oscillating around 50 percent in 2015 and 2016 and started sliding in 2018 to settle in at around 25 percent to 30 percent quarter on quarter growth here in the first half of 2019. Alibaba, which has been public since the end of 2014, came out strong with a doubling of revenue, and went promptly flat south of 30 percent quarter on quarter growth in 2015 and 2016, and fought to get to a more than doubling again in early 2018 and has slid back down to the doldrums again in early 2019. Except for the two years of the Great Recession, Baidu has been able to double or triple its revenues quarter on quarter from 2006 through 2016 except for a bad patch in early 2012, but it has actually had revenue declines in three quarters since then and tepid growth in several others to the extent that trailing twelve month revenues are holding flat.
This may or may not be the future of all of the hyperscalers and cloud builders. The population of Earth is only growing so fast, there is only so much stuff we can buy online, and there are only so many hours in a day to surf the Web. The wonder is not that hardware spending at these companies has slowed, but that it hasn’t already slowed long since. Only the relentless drive for ever more efficient iron, made possible by a limping Moore’s Law curve, keeps them throwing out a third of their iron every year and only ever more complex workloads and widening services portfolios drives them to spend. But their spending is perhaps growing faster than their revenues, and that cannot hold forever. Don’t get us wrong – there is plenty of money to be made still by the hyperscalers and cloud builders, and they will definitely keep growing faster than the economies they participate in. But hypergrowth is over, and has been for a while.
For those of you who like the detail, here is a table showing the top six vendors plus the ODMs as a group plus others:
This only shows data for the past six quarters, and so here is a chart that runs all the way back to the Great Recession for a longer view:
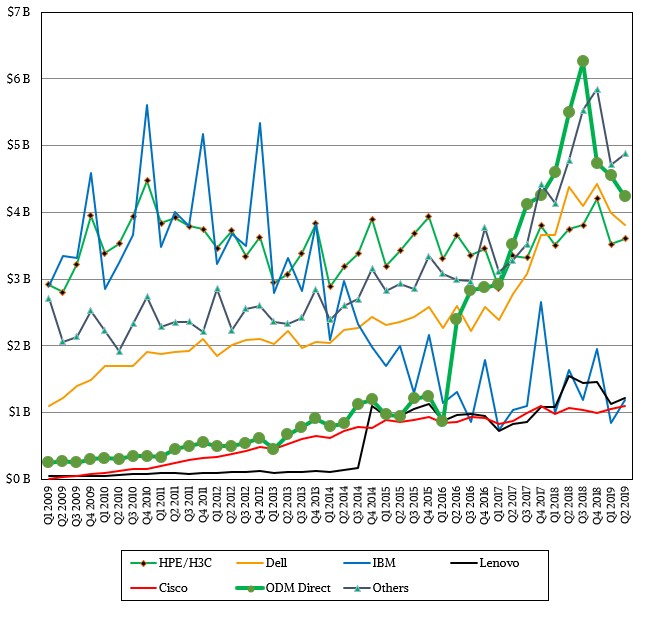
Inspur — and we do not have data back to 2009 for that Chinese server maker to add it to the chart, but we are working on it — is the big outlier this time around. The company had a 32.3 percent spike in sales to $1.44 billion, and shipments rose by 14.6 percent to 232,885 units. Every other OEM vendor and the ODMs declined on the revenue and shipment fronts, and if you lump everyone else together, they had revenue declines and shipment declines, too. Chinese manufacturer Huawei Technology took a 37.6 percent shipment hit, thanks in large part to the US-China trade war. Supermicro and Lenovo saw shipments drop twice as fast as the market at large, and Dell came close to that as well. HPE was only off 5.8 percent to 438,060 units shipped, but Dell was still the most prodigious server shipper, with 479,942 units out the door in Q2.
Interestingly, the Canadian server market had a 13.4 percent revenue bump and EMEA was up 2 percent; China contracted 8.7 percent, the United States was off 19.1 percent, Asia/Pacific was off was 8.1 percent, and Japan was down 6.7 percent.

The Big Clouds Get First Dibs On AMD “Genoa” Chips
The expanded lineup of AMD’s 4th generation “Genoa” Epyc server chips – built atop “Zen 4” core and some with the chip maker’s L3-boosting 3D V-Cache – unveiled at a high-profile event in San Francisco this week is quickly making its way into the cloud. Microsoft and Amazon Web Services both …
Supermicro Racks Up The AI Servers And Rakes In The Big Bucks
It was only six months ago when we were talking about how system maker Supermicro was breaking through a $10 billion annual revenue run rate and was setting its sights on a $20 billion target. Well, maybe $25 billion or even $30 billion would be better numbers given the unprecedented …
Intel Rounds Out “Granite Rapids” Xeon 6 With A Slew Of Chips
It is no secret that chip maker Intel is having a tough time these days on a number of fronts, but it is important to remember that nearly two out of every three processors sold into the datacenter are Intel Inside. This is a good business that can be moderately …
Server spending has not slowed. Sales have simple shifted from primary to secondary market for used equipment that IDC and others do not cover. Used serves the need for known ‘stable’ values running existing applications.
Equipment; servers, networking, communications that are now accumulated channel capital values are used and refurbished equipment. Kept in use are running existing applications and that funds primary development within the enterprise sweet spot of 8 to 18 cores. To do otherwise would send this industrial technical economy into financial chaos.
This fact, “buy used” pays for future innovation. Is aimed at network bandwidth and compute platform throughput, more cores, more development, adaptation, adoption where existing hardware is good enough for present commercial need ahead of evolving software and network enablement for more compute.
Of course more cores means fewer servers for any specific task where the number and type of tasks continues to deepen and broaden.
Few are willing to report how things got this way, on the over supply of Ivy Bridge, Haswell and Broadwell platform components following Westmere ramp. 32 nm to 22 nm process as stable presented an excellent period for fabrication, produced a lot of components, laundered a lot of production values; non reported non accounted and that’s what analysts and journalists tend to avoid on the industrial hazards of approved speech that is not freedom of speech on corporate network association.
More on this topic here;
https://seekingalpha.com/instablog/5030701-mike-bruzzone/5272437-xeon-channel-inventory-management-data
https://seekingalpha.com/instablog/5030701-mike-bruzzone/5272437-xeon-channel-inventory-management-data
Mike Bruzzone, Camp Marketing