

Businesses are judged quarter on quarter and year on year, but you have to look at the long haul and the flow of all business over time to really judge properly. That’s why we are data wonks here at The Next Platform.
And it is also why we are relieved that market researcher IDC has given some consideration a quarter ago to not publish its server revenue and shipment data. The same dataset that has been publicly available since 1995 showing quarterly server revenues and shipments by vendor, with lots of commentary and nuance added in, was made available this week by IDC for the first quarter of 2021. This slows for the kind of long history approach we like to continue for this important dataset, given that server spending is the most important component of IT investment in the world and has been for more than five decades.
In the quarter ended in March, global spending on servers rose by 12 percent to $20.9 billion, and shipments rose by 8.3 percent to just a tad under 2.8 million units, according to IDC. Granted, that is against a pretty easy compare, with Q1 2020 being the time when the coronavirus pandemic was just starting to have economic impacts. But we think that Q1 2020 was already looking weak given the amount of server consumption that the hyperscalers and cloud builders had done in Q4 2019 before everything went pear shaped here on Planet Earth.
“The first quarter 2021 server market performance benefited from a comparison against the most difficult quarter of last year’s pandemic stricken year, but this fact doesn’t tell a complete story,” explained Paul Maguranis, senior research analyst for Infrastructure Platforms and Technologies at IDC, in a statement accompanying the figures. “The considerable increase of server investments during the quarter were also buoyed by global economic tailwinds along with increased investments targeting the modernization of business applications, datacenter infrastructure, and IT operations.”
Here is what the data looks like over the long haul that covers the heart of the Great Recession in Q1 2009 through the beginning of the recovery of the coronavirus pandemic (we hope at least) in Q1 2021:
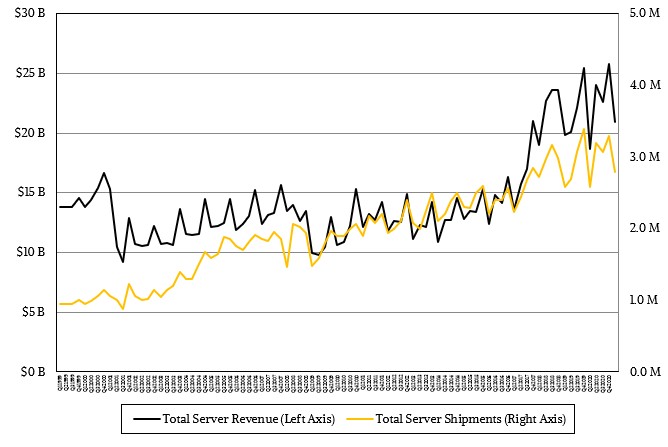 Now, if you look at those revenue and shipment curves over that time, you might be thinking that we ain’t never seen nothing like this before, that the Great Hyperscaler and Cloud Buildout is a brand new phenomenon with companies the world over consuming around 3X the capacity and spending nearly 2X the money to do it. Well, not exactly. There is a time value to money, and the world is much more dominated by software in 2021 than it was in 2009 – and it seemed pretty automated back then, didn’t it?
If you adjust this IDC data for inflation using the Consumer Price Index, as we do, then a slightly different picture emerges:
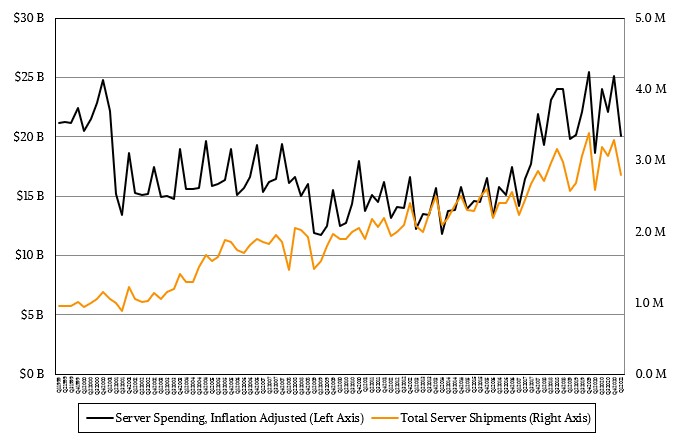 With this adjusted data, you can see that in terms of server spending, every other quarter or so we have another dot-com boom, which is a bit mind boggling when you think about it that way. If you really want to low your mind, think about how much compute and memory and I/O capacity is embodied in the nearly 3 million servers that shipped in the first three months of 2021 compared to the same capacities in the first quarter of 2009. That is not data that IDC gives out (and we are not sure that it does such estimates), but we have and this is what it looks like if you reckon the number of CPU sockets shipped, the number of cores per socket, and the relative performance per core over that long haul of time:
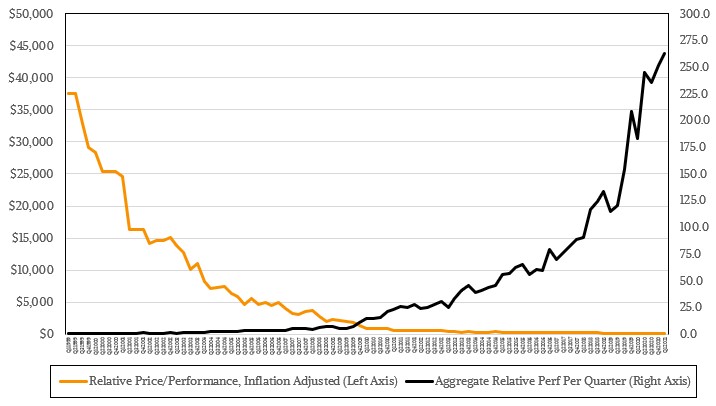 Those curves are an absolute testament to the power of Moore’s Law scaling and the nearly perfect elasticity of demand for compute. As it got less expensive per unit of compute and as more units could be crammed into a box, the world consumed more and more of it as more of the world became automated. In fact, without that curve, lots of the world would not have been automated at all. The desire for automation and augmentation doesn’t drive consumption in and of itself, but the ability to throw increasingly large units of compute against new problems does — so long as the cost keeps coming down fast enough. So far, so good. But nothing lasts forever.
Between Q1 2009 and Q 2021, the aggregate capacity of all the servers shipped has increased by a factor of 465X and the cost has come down by 307X. This is something we have observed in many markets, particularly supercomputers, where it is easier to add more capacity (and burn more juice) than it is to bring to cost down. Over time, that fact alone drives server spending, and if we wanted to get really crazy, we would build TCO models by quarter that take into account factors of space, power, cooling, and capacity. (A project for another day. . . .) Let’s just say that there is a reason that all of those hyperscaler services can be “free” and it is because the hyperscalers drive TCO like crazy, which the entire market either benefits from either directly or indirectly.
All of the major server OEMs plus the half dozen ODMs who manufacturer the machines that the hyperscalers and major cloud builders design for themselves and sources the parts for largely themselves showed growth in the first quarter. When we see that sort of behavior out of the market, this means the economy is improving and it is not just an architectural shift under way or competitive give and take between vendors or from OEMs to ODMs as workloads shift from on-premises datacenters to public clouds and hyperscale applications.
Not that these sort of things are not happening, of course. They are. But everyone has responded to these changes and adapted around them at this point. Some of this is just the benefit of new product cycles coming at the same time enterprises are ready to spend again to lay the foundation for their digital transformation and application modernization projects, which have taken on a new sense of urgency thanks to the pandemic.
While counting shipments is interesting, money is how we really keep score on Earth, and so here is the breakdown of OEM and ODM sales culled from the past nine quarters, which should give you a sense of the transitions:
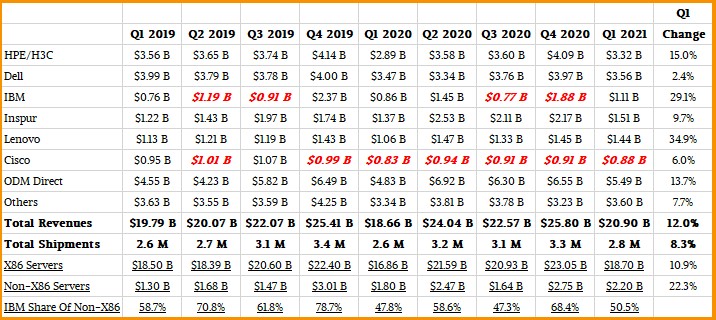
Sometimes, IBM or Cisco Systems – and sometimes both – have not made the top five cut in the IDC data and we have had to estimate their revenues and pull them out of the Others category. Those figures are shown in bold red italics to make a distinction between our estimates and actual IDC data.
As you might expect, X86 processors continue to dominate server revenues and shipments. In the first quarter, X86 machines based on processors from Intel and AMD accounted for $18.7 billion in revenues, but grew slower than the market at an increase of only 10.9 percent from Q1 2020. Sales of non-X86 servers rose by 22.3 percent, nearly twice as fast as the market at large, and we may be seeing the early effects of a few hyperscalers and cloud builders rolling out fairly large estates of Arm-based servers. Amazon Web Services is leading the way, but Microsoft, Baidu, and Tencent are not far behind here. Others will follow.
Some of that growth in the non-X86 sector was due to a bump in sales of IBM’s System z mainframes, but IBM’s Power Systems iron was down, although we think Inspur’s sales of Power9 machinery was probably up, perhaps balancing it out, perhaps increasing the overall Power slice of the server revenue pie a little. But this is just a hunch. If you back out IBM, then the non-IBM part of the non-X86 market grew by 16.1 percent to $1.09 billion. How much of that is Arm servers? A good healthy chunk, and when it is material, IDC will carve it out and tell us.

Fat Server Spending Props Up Slowing AI Servers At Dell
Just because you are the number one supplier of servers, storage, and PCs in the world does not mean the job of building those machines and making money is easy. It is not, and the financials of Dell Technologies shows just how tough it can be even when things are …
Taking The Pulse Of The Core HPC Market
Since a big chunk of the IBM HPC team moved over to Lenovo as part of the System x division being acquired by Lenovo back in late 2014, which coincided when we started The Next Platform, we have made a habit of talking to Scott Tease, executive director of high …
Dell Ties Storage To Kubernetes, Sharpens Edge Strategy
Dell Technologies, since its founding 37 years ago, has been about infrastructure — from the servers, networking systems and storage appliances that populate enterprise datacenters to the corporate clients that are designed to make employees more productive. Infrastructure is what has driven Dell to become a multinational IT giant that …
really nice work TPM, very comprehensive and appreciate the effort to gather all the data with thoughtful comments.