


The most exciting thing about the Top500 rankings of supercomputers that come out each June and November is not who is on the top of the list. That’s fun and interesting, of course, but the real thing about the Top500 is the architectural lessons it gives us when we see new systems emerge on the Top500 and we get to see how choices of compute, memory, interconnect, storage, and budget all play out at a system level and across nations and industries.
We would normally walk through the top ten machines on the list and then delve into the statistics embodied in the Top500. This time around, we have assembled a more usable feeds and speeds of salient characteristics of the top thirty machines on the list, which we feel is representative of the upper echelon of HPC supercomputing right now.
But first, before we do that, it is appropriate to just review the performance development of the top and bottom systems that are tested using the High Performance LINPACK benchmark and the total capacity represented in the entire list between for the past thirty years that the Top500 rankings have been compiled.
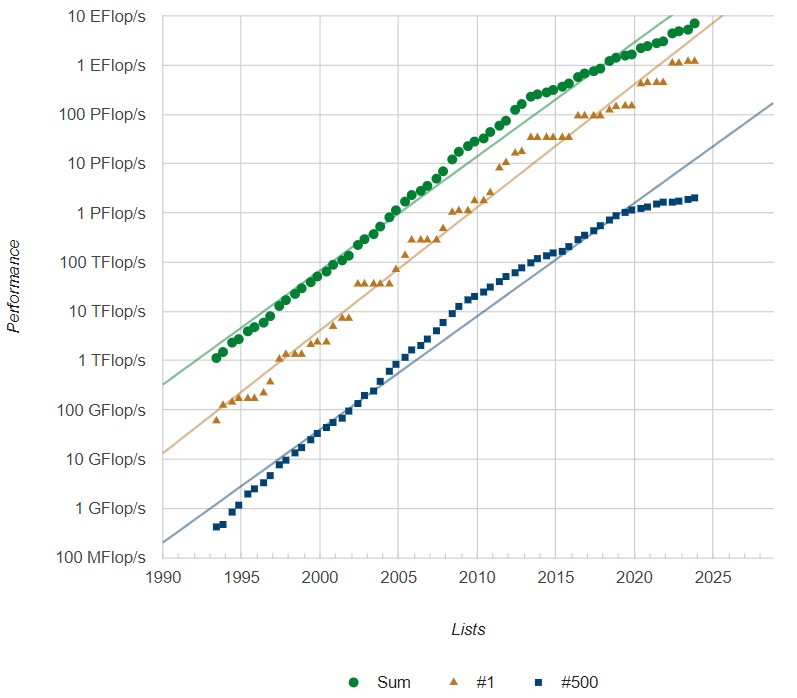
We have certainly strayed from the Moore’s Law curve that taught us to expect exponential performance increases. And it is fair to say that we have a very lopsided market – at least if you think those who submit HPL test results to the Top500 organizers are representative – with some very large machines comprising a large portion of the aggregate compute capacity on the list and a slew of relatively small machines that are nowhere near as powerful making up the rest.
A treemap of systems by architecture, created by the very clever Top500 database and graphing software, shows visually just how lopsided this is, with each square representing a single machine and each color representing a particular compute engine choice in the November 2023 rankings:
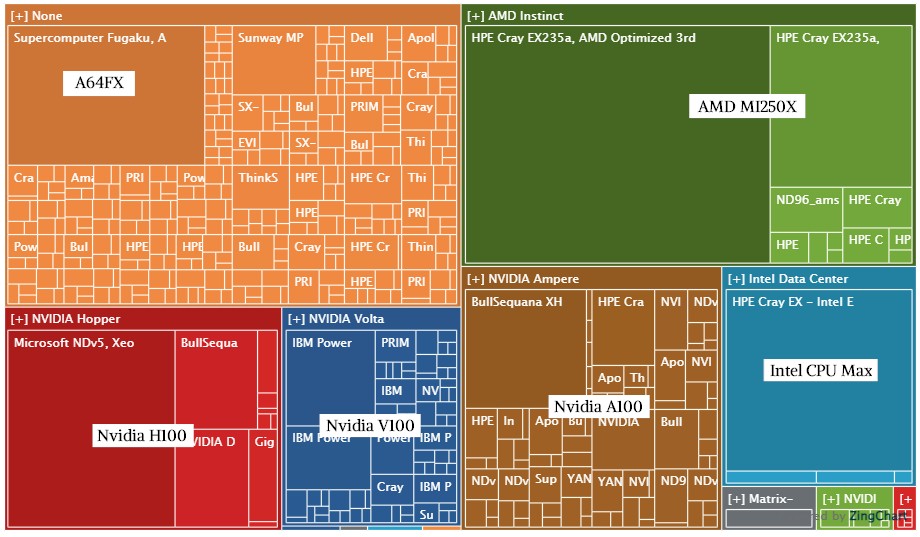
Going clockwise from the upper left, the big burnt orange square is the “Fugaku” system at RIKEN Lab in Japan based on Fujitsu’s A64FX Arm chip with big fat vectors. The olive green/brownish color in the largest square is the Frontier machine (hey, I see in color, I just don’t necessarily see the same colors you might) and the lighter version of this color is the AMD GPU neighborhood. The blue square at five o’clock is the half of the Aurora system that has been tested, and that purple area just below it is the “TaihuLight” system from 2016 based on the Sunway SW26010 processor (similar in architecture to the A64FX in that it is a CPU with lots of vector engines) at the National Supercomputing Center in Wuxi, China. The Nvidia A100 neighborhood is immediately to the left, with the “Leonardo” system at CINECA in Italy built by Atos being the largest square in this hood. The blue neighborhood at 6:30 as we move around is not just IBM, but includes the pre-exascale “Summit” machine at Oak Ridge and the companion “Sierra” machine at Lawrence Livermore National Laboratory. On the lower left you see that a new Microsoft machine called “Eagle,” which is running in its Azure cloud, is not only the third largest supercomputer in the official Top500 rankings but is also the largest machine using Nvidia’s “Hopper” H100 GPU accelerators.
As you see in the performance development chart above, the addition of some new machines among the top thirty machines has helped pull the average aggregate 64-bit floating point performance of the biggest 500 systems to submit results upwards. Notably, this includes the long-awaited “Aurora” supercomputer built by Hewlett Packard Enterprise with CPU and GPU compute engines from Intel and the Slingshot interconnect from HPE. Or rather, it includes around half of that machine, which has just a tiny bit over 2 exaflops of peak theoretical performance and which is, as happens with any new architecture, going through a shakedown period where it is being tuned to deliver better computational efficiency than its current results show.
The ”Frontier” system at Oak Ridge National Laboratory, comprised of custom “Trento” Epyc CPUs and “Aldebaran” MI250X GPUs from AMD all lashed together with HPE’s Slingshot 11 interconnect, remains the number one system in the world ranked by HPL performance. But there are two and possibly three different machines installed China that might rival Frontier and a fully tested Aurora machine. We have placed them unofficially on the Top 30 list, initially using the expected peak and HPL performance as assessed by Hyperion Research two years ago and then we just updated the table with better estimates of their current performance, so we can reflect reality a bit better.
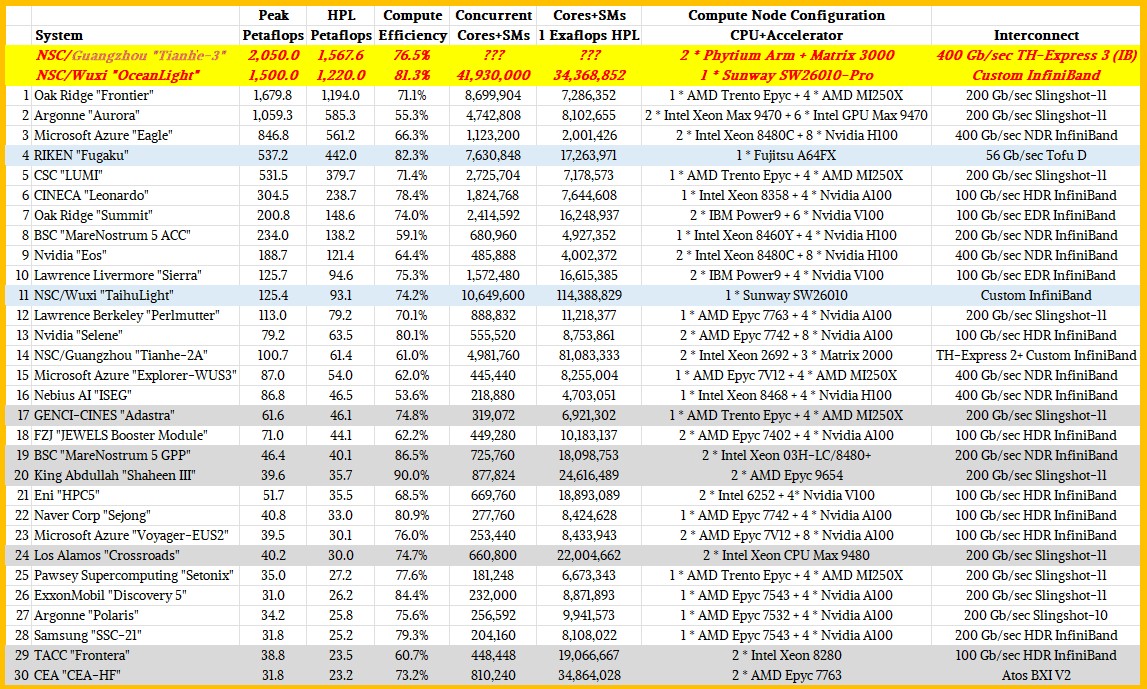
In the table above, the machines with light blue bars are using special accelerators that put what is in essence a CPU and a fat vector on a single-socket processor. Fugaku and TaihuLight do this, and so does OceanLight. The machines on the gray bars are CPU-only machines or partitions of larger machines that are only based on CPUs. The remaining 22 machines (not including the two Chinese exascalers in bold red italics and in the yellow bars) are based on hybrid architectures that pair CPUs with accelerators, and most of the time the accelerator is a GPU from either Nvidia or AMD.
If China published the test results for the “Tianhe-3” system located at the National Supercomputing Center in Guangzhou, and if the rumors are right, then this machine has 2.05 exaflops peak performance and somewhere around 1.57 exaflops on HPL. And that would make it the number one system in the world for the past several years, as we reported two years ago before SC21. The OceanLight system at NSC/Wuxi weights in at 1.5 exaflops peak and around 1.22 exaflops on HPL as far as we can tell from rumor and double-checks based on several papers that have been published about this machine. That makes them both more powerful than Frontier.
Considering that the compute engines in supercomputers are all expensive, we are always particularly interested in the computational efficiency of each machine, by which we mean the ratio of HPL performance to peak theoretical performance. The higher the ratio, the better we feel about an architecture. This is one of the few datasets that allows us to calculate this ratio across a wide array of architectures and system sizes, so we do what we can with what we have, but we know full well the limitations of using HPL as a sole performance metric for comparing supercomputers.
That said, we note that at 55.3 percent of peak, the HPL run on the new Aurora machine – or rather, about half of it – was not as efficient as Argonne, Intel, and HPE had probably hoped. We estimated back in May of this year that with a geared down “Ponte Vecchio” Max GPU running at 31.5 teraflops, with 63,744 of them in the Aurora machine, would deliver 2.05 exaflops of peak. At that low computational efficiency, the Aurora machine fully scaled out would only hit 1.13 exaflops on the HPL test, which is less than the 1.17 exaflops that Frontier is delivering. At somewhere around 65 percent computational efficiency, Aurora should hit 1.31 exaflops, and at 70 percent, it could hit 1.41 exaflops.
We think Aurora will get more of its peak floating point oomph chewing on HPL as Intel and HPE test the machine at a fuller scale. This is Intel’s first version of its Xe Link interconnect, which used to hook the Max GPUs to each other and to the “Sapphire Rapids” Xeon SP HBM processors in each Aurora node. Nvidia has shipped its fourth version of NVLink and AMD is on its third version of Infinity Fabric. These things take time.
There are a few other machines in the top thirty of the November 2023 list that are below the average computational efficiency. And it is not like other machines didn’t start out at this level (or lower) before and sometimes even after their first appearance on the rankings. For instance, we heard a rumor as we were awaiting Frontier’s appearance that it was well under 50 percent computational efficiency, which is why we didn’t see it when we expected it. In this case, there was a new CPU, a new GPU, and a new interconnect that all had to be tuned up together at scale for the first time. Ditto for the accelerator cluster (ACC) portion of the “MareNostrum 5” system at Barcelona Supercomputing Center in Spain or the “ISEG” system at Nebius AI in the Netherlands.
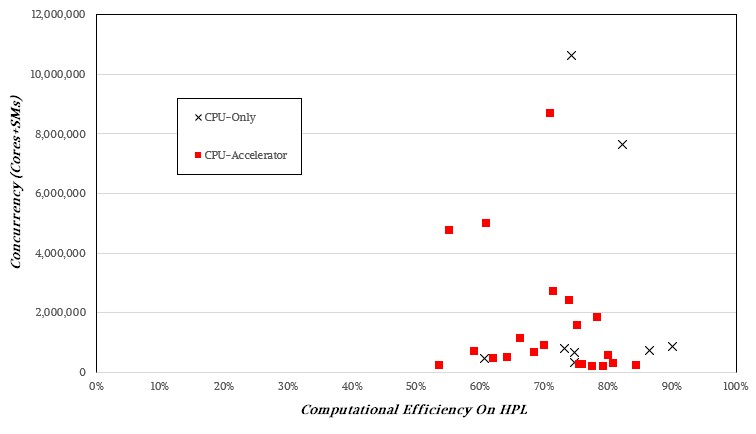
We expect for CPU-only machines to be more efficient because there is one fewer layer of networking involved. And indeed, if you average the computational efficiency of the eight CPU-only machines in the top thirty, you get 77.1 percent of peak flops for HPL, while the accelerated machines average 70.3 percent.
There doesn’t seem to be a discernable pattern if you plot computational efficiency across concurrency, so it is not like higher orders of concurrency mean lower computational efficiency:
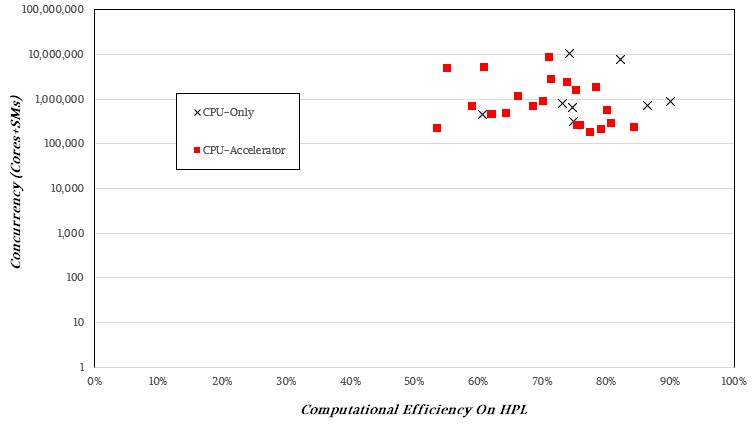
If you plot this on a log scale, there is no pattern that pops out, either.
We would also like to know, of course, if there is any correlation between HPL performance and real HPC simulation and modeling workload performance. For a lot of workloads, the HPCG benchmark, which chews up exaflops and spits them out with just terrible levels of computational efficiency, is probably a better gauge. And that is a bitter pill to swallow.