


It is pretty clear at this point that there is going to be a global recession thanks to the coronavirus outbreak. Maybe it will be a V-shaped recession that falls fast and recovers almost as fast, and maybe it will be a sharp drop and a much more prolonged climb back to normalcy. As we have pointed out before, we think that IT technology transitions are accelerated by such trying times, and this could happen starting soon. There is no doubt that companies are going to be even more aggressive in measuring the performance per dollar and performance per watt on every piece of hardware that will still need to go into datacenters in the coming days, weeks, and months.
As far as servers go, AMD, with its Epyc processors, is going to perhaps be the biggest beneficiary because it is the easiest drop-in replacement for the much more expensive Xeon SP processors from Intel. And while the Arm server chip upstarts, Ampere Computing and Marvell, were not planning for a global pandemic when they timed the launches of their chips on their roadmaps, they may be among the beneficiaries of the budget tightening that will no doubt start at most companies – if it hasn’t already. They would do well to get their chip samples ramped and products into the field as soon as possible.
We have reviewed the upcoming “Quicksilver” Altra processor from Ampere Computing and its future roadmap two weeks ago and also reviewed the upcoming “Triton” ThunderX3 processor from Marvell and its future roadmap this week. And now we are going to go through the performance and price/performance competitive analysis that these two chip makers have done as they talk about their impending server chips.
We realize fully that any vendor claims about performance have to be taken with a grain of salt – sometimes a whole shaker – but we also know that server buyers need to have at least a baseline idea of the performance of processors before they can even figure out what processors to test for their workloads. You have to start somewhere to get evaluation machines to run actual performance benchmarks on real workloads. No one is suggesting that anyone buy machines based on vendor competitor analysis, which would be utterly stupid. Our philosophy is to present as much information as possible and then provide some informed commentary about how to think about making comparisons across suppliers and architectures. Comparisons may be odious, but that doesn’t mean that they do not have to be made. Particularly in a recessionary climate like the one that we are very likely entering.
A few things before we begin. We noticed a certain amount of chatter out there after we published some feeds and speeds on the ThunderX3 chip and claims of the performance per core that Marvell thinks it will get with the Triton chip compared to the future “Ice Lake” Xeon SP chip due later this year. Marvell did its comparisons using the open source GNU Compiler Collection (GCC) compilers on both its own gear and that of Intel, and there was a certain amount of whinging about not using the Intel C++ Compiler (ICC). As we said in the article, this is a baseline performance run with standard flags, and we think it is not only absolutely valuable to have this consistent compiler substrate running across generations and architectures, we also think people have a very good sense that for a lot of workloads, the ICC compiler delivers somewhere around 20 percent more performance on a wide range of workloads. Unfortunately, a lot of them are microbenchmarks that have had their compilers tweaked to run things like the SPEC tests and others at peak efficiency and that may not be reflective of the baseline performance that a lot of actual applications will see. So, our attitude is that all CPUs should run the standard tests on GCC since it is supported equally well (or poorly depending on how you want to look at it) on all CPUs, and then each vendor should trot out their optimized compilers to show the uplift they get on these microbenchmarks and other systems level software such as databases and then the actual workloads should be tested. In this way, you can see the full spectrum of platforms and tunings and how it might be correlated in the past and in the future with actual applications.
This kind of basic information that the chip makers present is just the beginning of a long process. But it is also the ante to even be part of a CPU buying decision. So is price, and we can’t really do a full analysis of Arm server chips compared to X86 until the products actually roll out and we see the prices, too. (Ampere Computing and Marvell are giving some hints on price/performance, which we can work backwards to get an initial price for at least a few SKU in their respective lineups. This gets us started on the process of thinking about how these different chips might stack up to each other.
Let’s start with Ampere Computing and how it thinks its first generation Altra chip will do against the competition in the datacenter, beginning with SPECrate 2017 Integer tests:
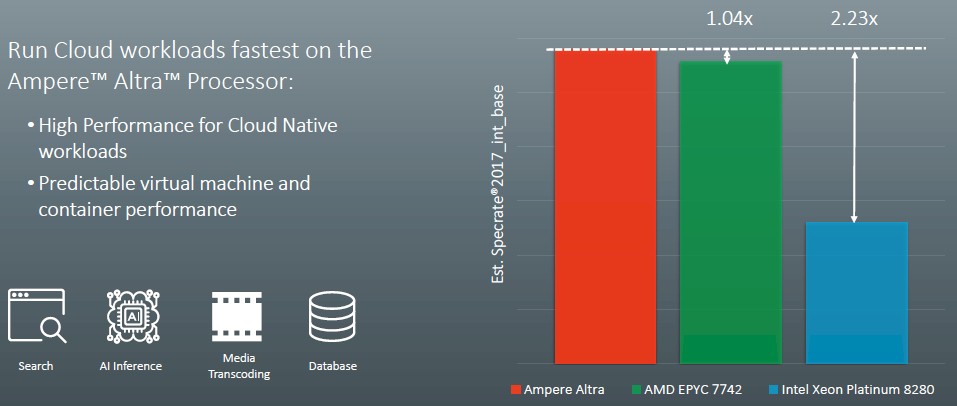
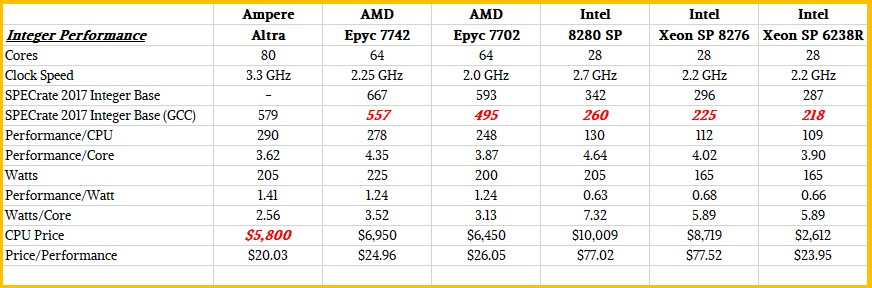
The Ampere Altra chip tested is presumably the 80-core version; it’s not clear. What we do know is that the system under test had two Altra processors running at 3.3 GHz turbo boost speed and that they were running the SPEC integer test with the GCC 8.2 compilers with the Ofast, LTO, and jemalloc options turned on. To get the number for the AMD “Rome” Epyc 7742, which has 64 cores running at 2.25 GHz, the figures for the Dell PowerEdge R6525 server tested last November (the best Dell system result with that processor) was used; that system had a base rate of 667 using the AOCC compiler. Ampere Computing then normalized this to GCC by multiplying by 83.5 percent, which it reckons is the ratio between AOCC 2.0 with the base options and GCC with the above-mentioned options. So that gives that two-socket machine an estimated rating of 557 and therefore each Epyc 7742 processor a rating of 278.5. Working backwards from this chart, then the Ampere processor with 80 cores has about 4 percent more integer oomph, or about 289.6. To get a number of the Intel Xeon SP, Ampere Computing chose the Dell PowerEdge R740xd that was tested back in March 2019 using a pair of 28-core “Cascade Lake” Xeon SP 8280 Platinum chips, which run at 2.7 GHz. This machine had a base SPEC integer rating of 342, which after a conversion to estimated GCC results by multiplying by 76 percent yields 260 and that works out to 130. By the way, Intel yields 4.64 per core at the GCC level, and AMD yields 4.35 per core compared to 3.62 per core for Ampere Computing.
What is annoying about what Ampere Computing has done in the following charts is that it is comparing different AMD Epycs and different Intel Xeon SPs with its Altra, and in some cases – as with the cost per total cost of ownership of a rack-scale cluster of servers – it is using a lower-bin Altra part in that comparison. We will normalize this as much as possible in a table that appears below, but let’s go over that Ampere Computing said before that.
The first thing we figured out is that it looks like the top-bin Altra part will burn 205 watts, not 200 watts flat, because that is the only way the numbers that are shown in the chart below work out:
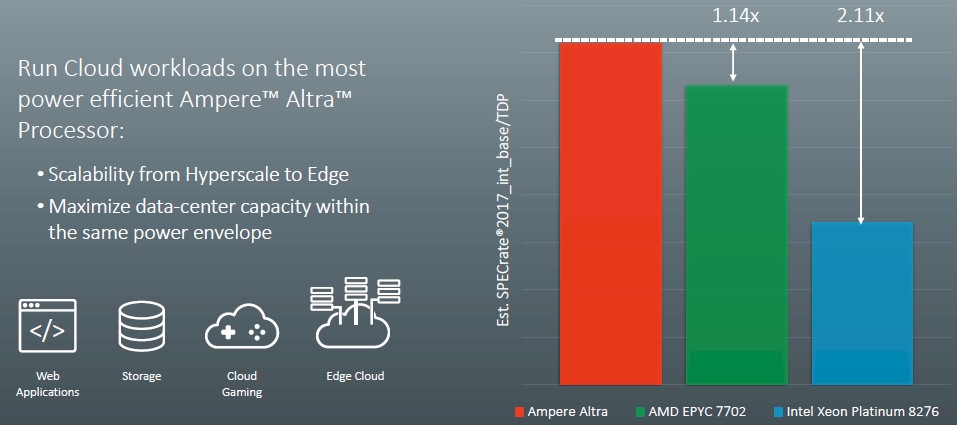
Assuming that it is keeping the 80-core part in the comparison but using a slower 180 watt part, which is mentioned in the notes on these charts, you will note that it has shifted to the AMD Epyc 7702 for the comparison above, which has 64 cores running at 11 percent lower clock speed and which also, at 200 watts, burns 11 percent less juice than the 225 watt Epyc 7742 shown in the first chart. The SPEC integer test for that machine, a Dell PowerEdge R6525, is here. Similarly, the Intel chip compared here is the Xeon SP 8276, which has 28 cores running at 2.2 GHz (down 18.5 percent from the Xeon SP 8280) and which costs $8,719 (down 12.9 percent from the $10,009 price of the Xeon SP 8280). The SPEC integer benchmark result is here for a Dell PowerEdge MX740c based on a pair of these CPUs.
This chart talks about watts per core comparisons of the same processors:
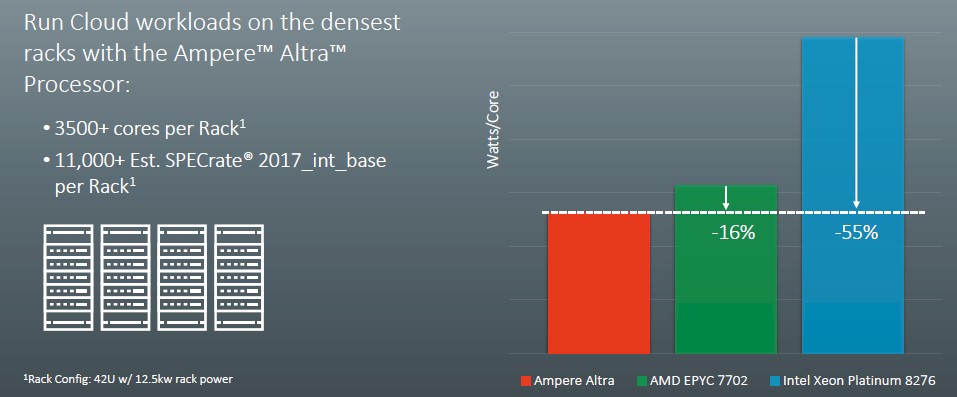
The cores are less oomphie in the Ampere Altra chips than in the Epyc or Xeon SP processors, so it is no surprise that the watts per core is lower.
Based on all of these different SKUs and data points, here is a summary table that adds it all together, including the GCC performance estimates:
Based on the idea that Ampere Computing has to offer at least a 20 percent price/performance advantage at the chip level compared to the best that Intel and AMD can throw at the cost per performance per watt equation that dominates the buying decisions of the hyperscalers and cloud builders that Ampere Computing is targeting. We also ginned up what the 180 watt Altra part might look like based on some very serious guessing. The pricing on such a chip, we think, would be even more aggressive and go after the belly of the Xeon SP market: Those aptly named Gold processors, like the new Xeon SP 6238R.
That brings us to the last chart in the deck from Ampere Computing, which shows the performance per total cost of ownership deltas between the four chips shown below:
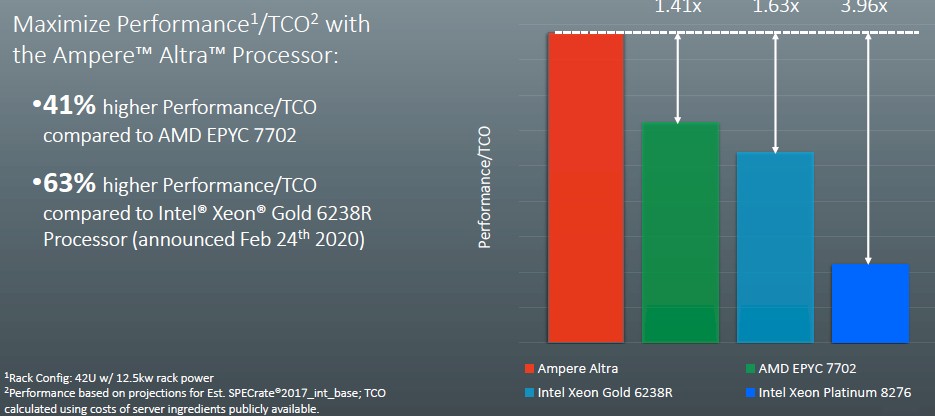
This is a system level comparison and the rack of servers using the Altra processors are using a pair of those 180 watt parts (which we estimated some feeds and speeds for) plus sixteen 16 GB memory sticks (256 GB of memory), a pair of Ethernet NICs, a 1 TB SATA drive, and base components like baseboard management controllers, power supplies, and such. The AMD Epyc 7702 server has a similar configuration, and the two Intel machines assume twelve memory sticks because they only have six memory controllers per socket. Ampere Computing has created a TCO tool that does all of this math, presumably with a lot of servers and different CPU SKUs.
What this chart says is that basically for every dollar that you spend on a rack of servers using a pair of Xeon SP 8276 processors, you will get nearly four times as performance using a rack of the 180 watt Altra processors, and the multiples are 1.63X compared to a rack of systems based on the much more reasonably priced Xeon SP 6238R processors and 1.41X that of a rack of systems based on the aggressively priced AMD Epyc 7702 processors. It is not really possible to easily guess what these system comparisons might be that Ampere Computing had in its TCO tool, but we look forward to playing with that TCO tool when it becomes available.
Where There Is Thunder, Lightning Has Struck
Marvell, as we said, is providing some performance data as well, although it is of a different type but is consistent with the kinds of data that Cavium has provided in the past as it launched the ThunderX1 and ThunderX2 processors.
The first thing that Marvell wants everyone to ponder is just how many virtual machines each one of its processors can host. At 96 cores for the top-bin Triton ThunderX3 part and four threads per core, that is 384 threads that can each, in theory, support a virtual machine. And even if the threads are ignored and a virtual machine is allocated to a core, AMD Epycs top out at 64 cores, or a 50 percent advantage to Marvell, and Intel really – for all practical purposes – tops out at 28 cores or a 3.4X advantage. If you want to do threads for each VM, then the advantage to Marvell over Intel is 6.85X and over AMD is 3X.
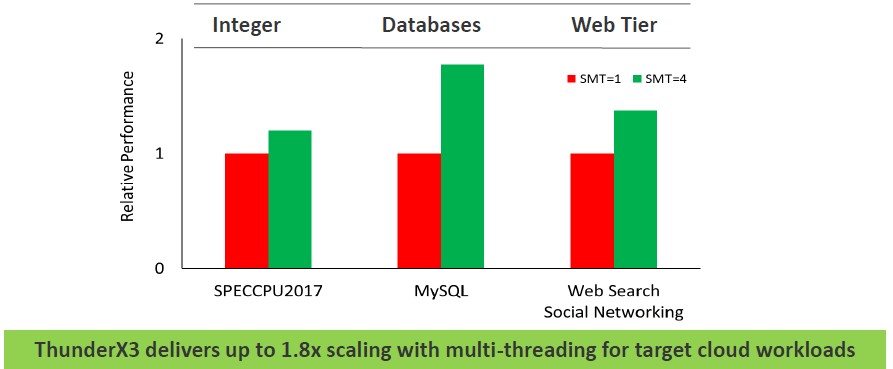
Here is another interesting chart from Marvell that talks about the effect of simultaneous multithreading (SMT) on various workloads. Take a gander:
Now let’s get down to the X86 comparisons. In its tests, Marvell is looking at the SPECrate 2017 Integer Peak performance of the chips. The ThunderX3 is the CN110XX variant, which has 96 cores running at 2.2 GHz with a turbo boost to 3 GHz with a 240 watt thermal design point. These are compared to 28-core Intel Xeon SP 8280 Platinum at 205 watts and a 64-core AMD Epyc 7742 at 225 watts. Marvell is doing adjustments from the ICC and AOCC compilers to GCC where necessary and using the GCC compilers where possible to normalize everything to GCC performance levels across these architectures.
Here is the relative performance of these three processors, further normalized against the Epyc 7742 chips (meaning, their performance is set to 1.0 and the others are reckoned against this):
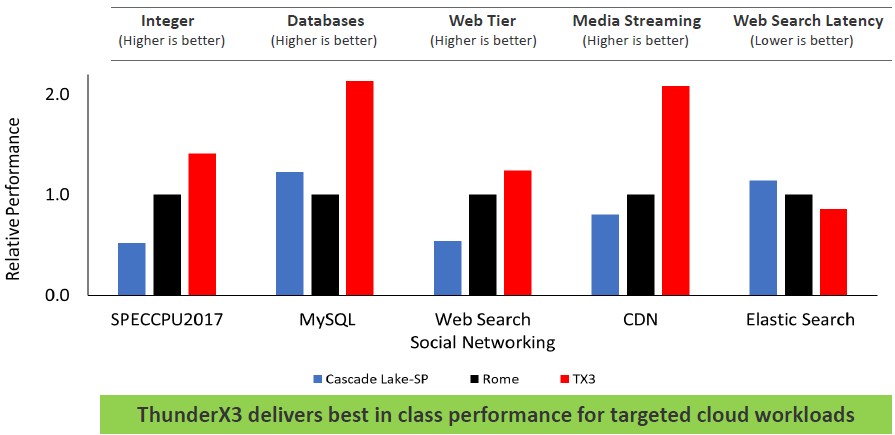
The top-bin ThunderX3 has some to a lot of performance advantage over the Epyc and sometimes the Xeon SP chips do better than the Epycs. Be careful with interpreting web search latency as gauged by Elasticsearch – lower is better, not worse in that part of the chart.
Now here is some insight into how Marvell thinks the top-bin ThunderX3 will stack up against the AMD Epyc 7742 and Intel Xeon SP 8280 on HPC workloads:
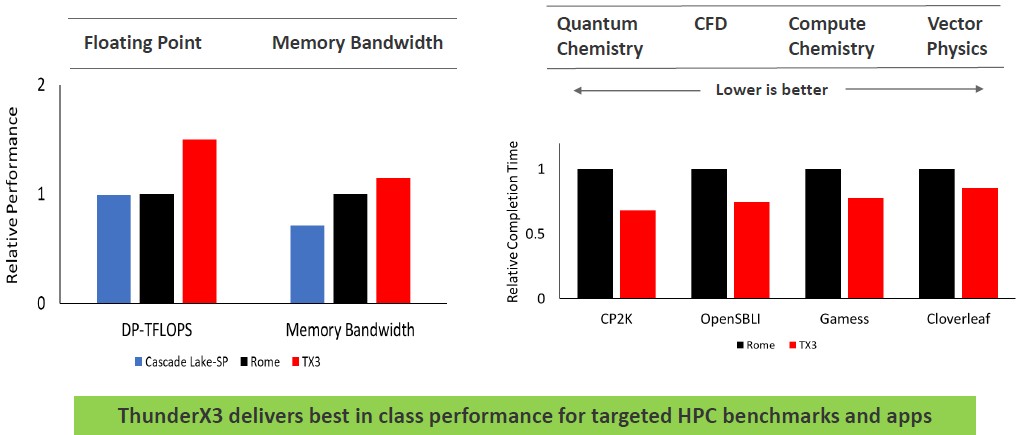
Because of the expected higher clock speed of its four SIMD units, Marvell is going to have a raw floating point advantage over the Cascade Lake Xeon SPs and Rome Epycs, according to the company. It will also have a small memory bandwidth advantage over the Rome chips and certainly some over the current Cascade Lake chips, but probably not on the future “Ice Lake” Xeon SPs Intel is planning to get out this year. And as you can see, systems based on the ThunderX3 are expected to have an advantage over the Rome chips on key HPC workloads. The question we have is how ThunderX3 will match up against the “Milan” Epyc 7003 family of chips shipping later this year as well. It is hard to say, but that gap could close up.
It would have been useful if Marvell had provided absolute rather than relative performance here. We could have had more fun with math.