
One of the neat things about modern AI is that a whole new generation of people in a field outside of economics (but certainly driving the modern economy) has been introduced to curves showing the Pareto frontier.
Famously, Nvidia co-founder and chief executive officer used these Pareto frontier curves in describing the tradeoff between AI inference throughput and response time performance during his GTC 2025. Vilfredo Pareto, of course, is the Italian mathematician, civil engineer, and economist who created the 80-20 rule during Gilded Age I, observing that 80 percent of the wealth in Italy was concentrated in the hands of 20 percent of the population. (We are pretty sure that he might have also observed that 80 percent of the work in his home country was done by 20 percent of the people, and that ultimately this was true outside of Italy as well. . . . )
Pareto curves were initially used to plot out quality control improvements in the Industrial Revolution, and Pereto frontiers are special kinds of curves that balance multiple objectives and help to show various tradeoffs between them as variables are changed. You make one variable worse, the other gets better, and somewhere in the middle of the Pareto frontier curve is probably the right balance between the two for most cases. (There is probably a Pareto distributions of exceptions to this rule. . . . But that hurts our head.)
Here is a Pareto frontier curve that Huang showed off at the GTC 2025 opening keynote in March that showed the throughput and response time optimization points available by tweaking the number of GPUs and parallelism type in an unnamed large language model. (We are guessing that this is GPT, and probably GPT4 and maybe GPT4.5 given the timing.)

The Hopper curve on the bottom left shows the distribution of performance with and without the Dynamo and TensorRT inference stack, which obviously shifts out the curve, on an eight-way GPU node using H200 GPUs running at FP8 precision. The Blackwell curve shows a much larger shared memory GPU cluster, with 72 of the B200s as well as a drop to FP4 precision. Half the precision doubles the throughput, and having a rackscale system instead of a node gives you 9X on top of that. Add in Dynamo and TensorRT optimizations, and at the sweet spots in the H200 and B200 curves, the Blackwell system at a given level of parallelism delivers about 5X more tokens per megawatts and about second 5X more tokens per user for a multiplicative 25X boost in performance. (We measured the lines on the chart to check that, and it looks more like it was closer to 31X by our measure and math, but perhaps Huang was rounding for simplicity.
That was using a dense, blurty, monolithic model that is entirely activated with each token generated for each query, and as you can see the throughput normalized for megawatts peaks out at about 9.5 million tokens per second per megawatt for pretty low throughput per user for a GB200 NVL72 compared to about 2.3 million tokens per second per megawatt for a relatively puny H200 NVL8 system.
But look at how the throughout per megawatt drops when you shift to a reasoning model:

This model behind this curve might be any number of so-called chain of thought models, which do a lot of token generating and consumption across different models strung together before they come to a consensus about the answer and give it to you. It might be a GPT, it might be a DeepSeek. Nvidia did not say.
As you can see, the throughput per megawatt is down by a factor of 11X by shifting to a reasoning model – something we didn’t catch while looking at these curves back in March – but the throughput per user is about the same depending on the layers of expert, tensor, data, and model parallelism used. And the performance advantage of the sweet spot for the B200 system versus the H200 system is 40X (about 6.5X more tokens per user and about 6.5X more tokens per second per megawatt.)
We got another set of Pareto frontier curves from Nvidia when the company described the hardware and software performance of systems using its “Hopper” H200 and “Blackwell” B200 GPUs on the three different AI models that comprise the new InferenceMax v1 benchmark suite from SemiAnalysis. And that got us to not just thinking about the performance of Nvidia systems, but how in the AI space, the models are changing so fast and software is being constantly tweaked and tuned to better take advantage of hardware that in a very short period of time the Pareto frontier of throughput and performance is shifted out like a shock wave.
These InferenceMax benchmark uses the GPT-OSS 120B, DeepSeek R1-0528, and Llama 3.3 70B Instruct models; the first two are reasoning models, the latter one is a dense, blurty one. InferenceMax lets you look at throughput per XPU – it only has a few configurations of Nvidia and AMD GPUs right now, but different types of XPUs will hopefully follow – as well as throughout for the cluster sizes tested, and cost per million tokens to buy, to host in a neocloud while owned, and to rent from a cloud. You can vary the input and output sequence lengths of each model to see how that affects the shapes of the Pareto frontier curves.
The Rules Of Thumb: 2X and Then 5X More
Since the machine learning resolution took off in earnest around 2012 or so, Nvidia has been working feverishly on both hardware and software. Speaking very generally, performance per GPU for specific kinds of math units – 32-bit vector cores or 16-bit tensor cores – for instance – has gone up by somewhere between 1.5X and 3X, averaging around 2X or so. And then, once the hardware is out and in the field for two years, the performance has been boosted by software by around another 5X or so to yield a 10X jump by the time the next hardware generation comes along and there is another 2X or so hardware bump and the cycle starts again.
This story is not so much about the Pareto frontier curves as it is in gauging the speed of change in the Pareto frontier curves, and Nvidia walked us through the past few months of testing starting with the InferenceMax benchmark submissions it did and then optimizations it did in the following weeks – not months – that moved that Pareto shockwave out.
Two other Pareto rules occur to us. One, 80 percent of Nvidia’s money comes from hardware, but only 20 percent of the money comes from software. But two, 20 percent of Nvidia employees work on hardware, while 80 percent work on software. And that is how software ends up driving 60 percent of the performance gains on any given generation of GPU systems from Nvidia. (Oh man we wish that was 80 percent, but it doesn’t average out that way. Software is just plain harder.)
Here is a pretty chart showing the GPT-OSS reasoning model Pareto frontier curve with throughput per GPU on the Y axis and interactivity (tokens per second per user) on the X axis for a GB200 NVL72 rackscale system:
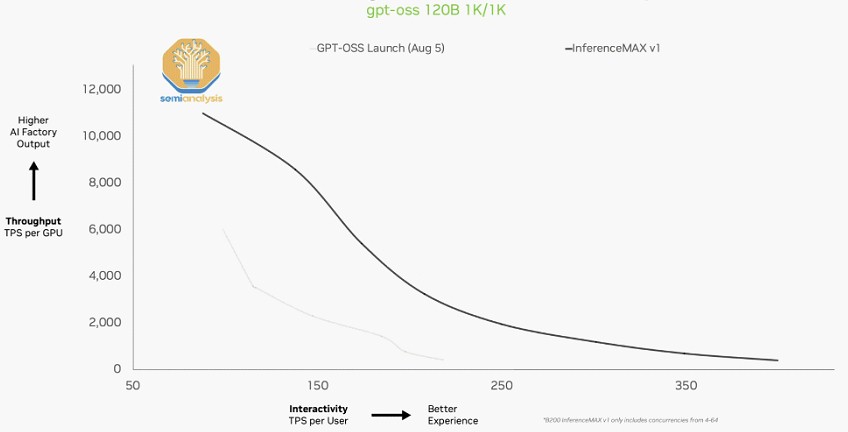
The performance almost doubled all along the Pareto frontier between the beginning of August and the end of September when the InferenceMax v1 test results were submitted.
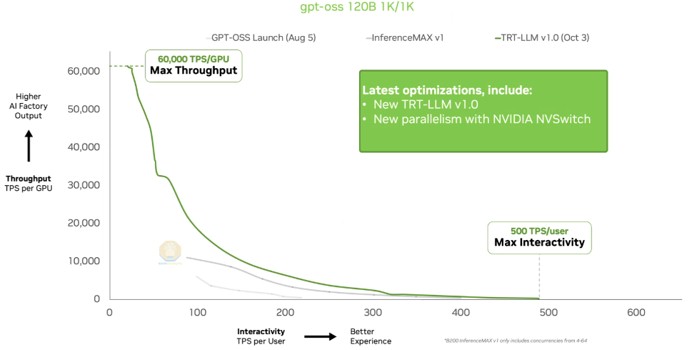
And then on October 3, when Nvidia made some enhancements in the TensorRT inference stack as well as new ways to parallelize data accesses across the NVSwitch memory interconnect in the rackscale system, the Pareto frontier curve was not only pushed out, but the ends of the curve were stretched out closer to the Y and X axes, boosting the maximum throughput for a small number of users to more than 60,000 tokens per second (TPS) per GPU and boosting the maximum user interactivity to nearly 500 TPS per GPU for a high level of interactivity for a small number of users.
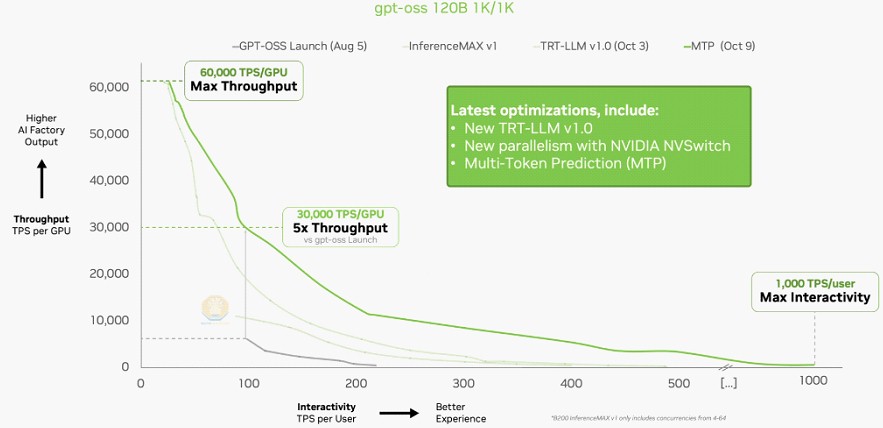
Then less than week later, on October 9, Nvidia added multi-token prediction, a kind of speculative execution for AI models, to the software stack and this changed the shape of the Pareto frontier curve such that Nvidia could push 1,000 TPS per user for the maximum interactivity and could deliver 5X the throughput at around the 100 TPS per user rate set as the peak throughput of the original GPT-OSS benchmark run in August.
What used to take Nvidia two years or so to do in software – deliver a 5X performance improvement on the same hardware – it did in a matter of weeks.
To which we quipped to Nvidia when we talked about this: “Well, why the hell didn’t you do this all in the first place?” Which got an initial shock as well as laughter.
The answer is, of course, that the hardware is changing fast, and the software is changing even faster. GenAI is one of those parts of the IT sector where it really does matter to keep current on the software. It is worth billions of dollars in performance to do so.

The NVSwitch Fabric That Is The Hub Of The DGX H100 SuperPOD
Normally, when we look at a system, we think from the compute engines at a very fine detail and then work our way out across the intricacies of the nodes and then the interconnect and software stack that scales it across the nodes into a distributed computing platform. But this …
Berkeley Lab Opens Bidding For Future NERSC-10 Exascale System
The National Energy Research Scientific Computing Center at Lawrence Berkeley National Laboratory, one of the key facilities of the US Department of Energy that drives supercomputing innovation and that spends big bucks so at least a few vendors will design and build them, has opened up the bidding on its …
Nvidia Licenses NVLink Memory Ports To CPU And Accelerator Makers
There are many reasons why Nvidia is the hardware juggernaut of the AI revolution, and one of them, without question, is the NVLink memory sharing port that started out on its “Pascal” P100 GOU accelerators way back in 2016. And now, after nearly a decade in the field and with …
Hum,
TPM states, “Two other Pareto rules occur to us. One, 80 percent of Nvidia’s money comes from hardware, but only 20 percent of the money comes from software. But two, 20 percent of Nvidia employees work on hardware, while 80 percent work on software. And that is how software ends up driving 60 percent of the performance gains on any given generation of GPU systems from Nvidia.”
I’ve found on a net financial basis, Nvidia hardware margin is the same as AMD and Intel on a good day; low to mid 50’s. Nvidia Gross is said 72ish % but that’s not hardware on marginal cost production and bundle deal sales close volume, and Nvidia competing price wise stimulating supply elastic product demand systematically from peak production volume into run end.
Systematically, because I don’t think Nvidia pays much attention to the overall difference in ‘run down’ margin, running ahead of competitive [un]knowns on Nvidia’s seat aimed growth objective. Grab as much real estate as you can for mass and into future leverage.
TPM suspect 80 : 20 is close. I have hardware responsible for 72.6% of Nvidia ‘net take’ and the other which one can presume is software, 27.4%, and I really think it’s closer to 70 : 30.
Nvidia stating into the 70’s gross margin really needs to be broken out into hardware and software for transparent reporting.
On increase in token generation given parallelism, matrix and linear code performance, part and partial gaining throughput, might also present a transparency question on the reliability of slim code to achieve a valid result across ever larger pools of coincident raw data. I get it for vision systems and motion estimation but for more complex reasoning I remain sceptical whether the output is actually a quantifiable good result.
Mike Bruzzone, Camp Marketing