

There is a very interesting technical side to IT infrastructure, which we are obviously very keen on exploring here at The Next Platform. But there is an economic side that we also watch like a hawk.
We have always believed at server and storage spending are leading indicators of the global economy, and that if spending is boisterous then companies are optimistic or terrified about the future – or both at the same time. The dot-com boom was one such bubble that combined optimism about the possibilities for transforming applications as well as giving companies anxiety about not being able to compete with their compute. The AI revolution is another one.
And so, when we can get our hands on some infrastructure spending data, we pull it apart and plot out the trends. We have just done this with the cloud and bare server and storage spending numbers released by IDC today to give you a sense of what is happening, how it compares with the past, and what the most recent spending forecast is from the market researcher.
Last year, much to our chagrin, IDC stopped providing statistics for raw server sales to the public and this converged server-storage dataset is all it talks about that gives us a sense of spending. The bad news is that we have lost access to a dataset that goes back to 1995, but the good news is that this converged server and storage data has eliminated double counting. This new way of doing things also breaks serving and storing infrastructure into three buckets: shared cloud (what many call public clouds), dedicated cloud (which can be hosted in a co-lo, in a cloud, or on premises within a company), and non-cloud (what we would have called bare metal perhaps, but that is not exactly precise either because there are some virtualized systems that are not precisely cloudy.
We take our datasets as we can get them, and do what we can to make them useful.
It takes along time to pull this data together, which is why we are getting Q2 2022 figures on server and storage spending just as Q3 2022 is ending.
In the period ending in June, spending on cloudy infrastructure that has utility pricing for all capacity and that is either shared on a cloud like capacity is on Amazon Web Services, Microsoft Azure, Google Cloud, IBM Cloud, Alibaba Cloud, and so forth, or is dedicated on a cloud, a hosting provider, a co-lo, or on corporate premises through mechanisms like AWS Outposts, Hewlett Packard Enterprise GreenLake, Dell APEX, or Lenovo TruScale. In the second quarter, all cloud server and storage spending rose by 22.4 percent to $22.6 billion, and of this $7 billion was for dedicated cloud infrastructure (up 46.3 percent, showing how this part of the infrastructure market is growing very fast) and $15.6 billion was for shared cloud infrastructure (up a still healthy 18.9 percent). Of the dedicated cloud revenues, $3.2 billion of the $7 billion spent was for infrastructure that was installed on company premises, and this was up 45.7 percent year on year. Dedicated server and storage infrastructure running outside of the corporate premises drove $3.8 billion in sales, up 46.9 percent. So these two pieces of the dedicated cloud part of the part are both growing at about the same rate according to IDC.
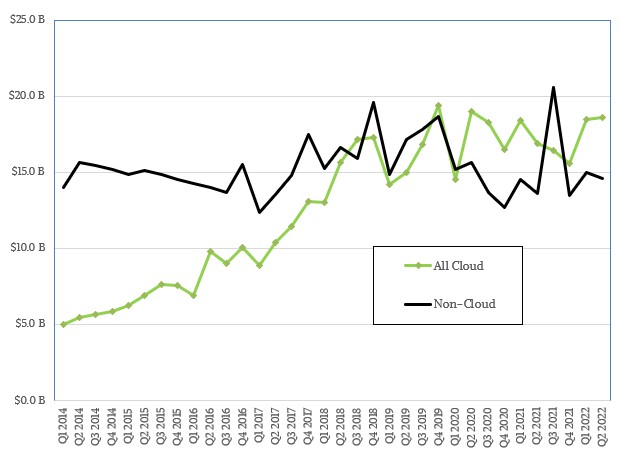
Spending on non-cloud infrastructure – meaning servers and storage that are literally acquired or sold under a lease but not a rental model that lets customers dial capacity up and down and that is probably bare metal or containerized but not heavily virtualized – rose by 15.2 percent to $17.3 percent.
For those of you who like to see the raw data, here is the model that we have built over the past two years using the IDC data, including revisions as we are aware of them in prior data:
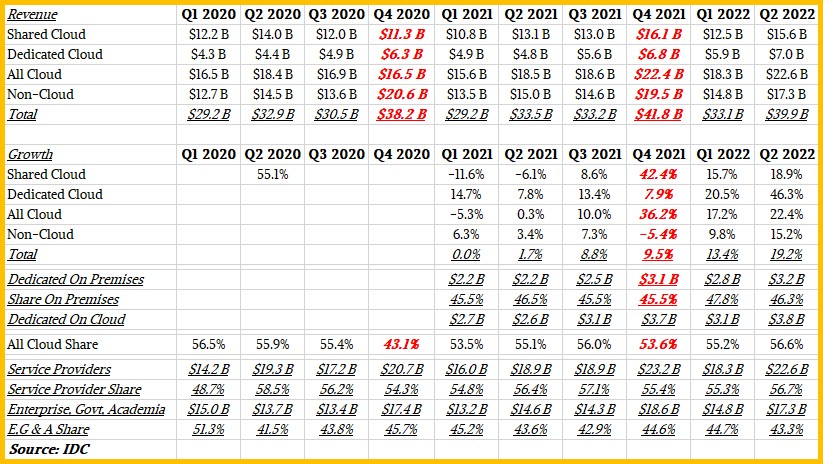
It is interesting to note that spending by service providers – what we would call hyperscalers, cloud builders, service providers, and telcos – grew by 19.7 percent to $22.6 billion in the quarter and comprised 56.7 percent of total sales. The rest of the infrastructure was bought or rented by enterprises, government agencies, or academic institutions, amounting to $17.3 billion, up 18.5 percent. The service provider pack crossed above 50 percent of the total back when the coronavirus pandemic was roaring, and it is not going to go back if the forecast by IDC comes true.
Here is IDC’s forecast chart out to 2026:
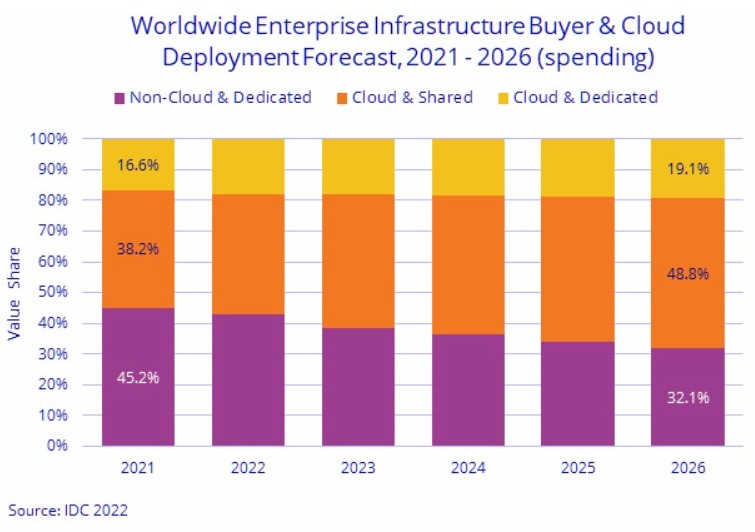
This is not a particularly useful chart in that it really only shows you one thing, namely what portion of sales will be shared cloud, dedicated cloud, or non-cloud. So we took all of IDC’s statements past and present and built this much more useful table showing past sales and forecasts, including for service providers and everyone else:
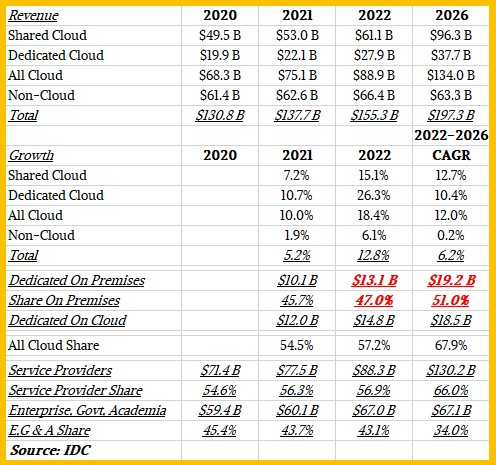
Here is the interesting bit: Service provider sales (in the largest sense meant by IDC) will have a compound annual growth rate of 10.9 percent over the 2022 through 2026 span, reaching 130.2 billion at the end of the period. If you do the math on that, the service provider share will account for 66 percent of all server and storage buying, and enterprises, governments and schools will only account for the remaining 34 percent share, absolutely pancake flat compared to sales of servers and storage in 2022 for this collection of customers.
We shall see how this plays out.
[Raising a hand] Hey, IDC. How do you count acquisitions of bare metal servers by service providers that are then turned around and sold as cloud infrastructure to end user customers? Have you ever read If You Give A Mouse A Cookie?


Great stuff Tim, appreciate the work that goes into this. Agree with the on-prem growth ramp conclusion, makes perfect sense. The question, as you elude, is whether the macro economy throws a wrench in or not. cheers
Silly to divide up the market by whether someone does or doesn’t slap a hypervisor on the box.
There’s really just “someone else’s computer” and “your computer”.
Also, how does IDC get people to pay for no-knowledge extrapolations like that one (“from now on, there will be a linear trend to put hypervisors on everything”)?