

Whenever demand exceeds supply, inflation is inevitable. And it is not at all surprising to find that in certain sectors of the networking space, the cost of bandwidth is flattening out instead of decreasing and in some cases is on the rise.
And at least until the semiconductor market settles down and customers stop being freaked out about potential supply issues as they build out their datacenters – that could take years, given the uncertainties in the world – we don’t think the situation will change much.
The good news is that the companies that supply the switches and routers that weave together the campus, edge, and datacenter networks that power our businesses and our lives did a pretty good job despite the coronavirus pandemic and all kinds of materials, ASICs, and manufacturing issues, according to a quarterly report on the switch and router markets coming out of IDC for the fourth quarter of 2021.
As usual, we have plowed through the numbers and plugged them into our models to calculate trend data based on the publicly available data from IDC. This is a public service for the IT market, providing some general data that is useful to try to figure out what is going on out there in the datacenter. Interestingly, IDC decided at the end of 2021 to no longer provide the companion datasets for servers and external storage arrays. Gartner also decided to stop providing public slices of its datasets last year, too. This is a bad sign, and it probably bodes ill for the quarterly switch and router tracker coming out of IDC, which we have found particularly useful over the past several years.
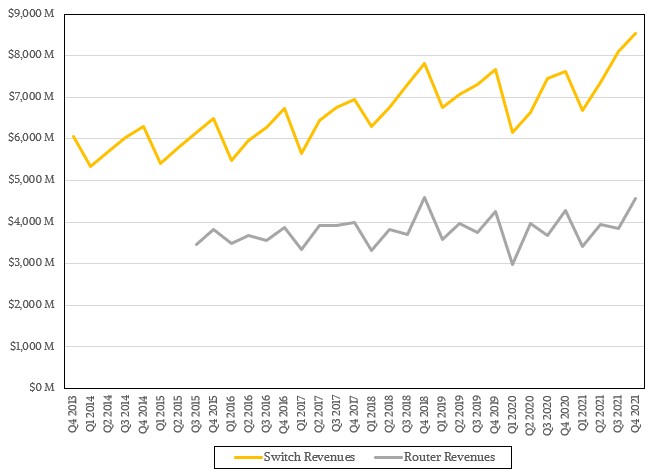
In the quarter ended in December 2021, the overall Ethernet switch market rose by 11.8 percent to $8.5 billion, and for the full year rose by 9.7 percent to $30.7 billion, according to IDC. Router sales worldwide rose by 7 percent in the fourth quarter to $4.6 billion, and accounted for $15.9 billion for all of 2021, up 6.5 percent. The only view we have into IDC server data is a tweet from Matt Eastwood, senior vice president of infrastructure at the market researcher, and he said that the server market grew by 6.4 percent year-on-year to exceed $100 billion in sales for the first time in history, pushed by 13.5 million servers shipped last year with nearly 215 million cores across those machines.
The public statements for the switch and router tracker are jam-freaking-packed with useful statistics, and if you keep track of each quarterly report, you can build a pretty good set of trend data. It is a bit tricky to work in any revisions that IDC has backcast into its datasets, admittedly, but this is what we have to work with and we have never been shy about making estimates where there are holes in the public data because, frankly, you would have to do that on the back of a drink’s napkin if we didn’t do it for you.
In recent quarters, IDC has talked about the datacenter versus the non-datacenter portions of the market, and you can pretty much use 10 Gb/sec switching as the border between the two. There is a lot of campus and edge iron that runs at 10 Gb/sec and below and there is an increasing proportion of datacenter switching (but not all of it to be sure) that runs at 10 Gb/sec or higher.
What we are always interested in when we see this raw data for each quarter is how the aggregate capacity shipped is changing and how the cost per bit moved is changing in switches, and we do a lot of spreadsheet magic to try to figure this out. Here is our best guess of what the fourth quarter for Ethernet switching looked like across different speeds:
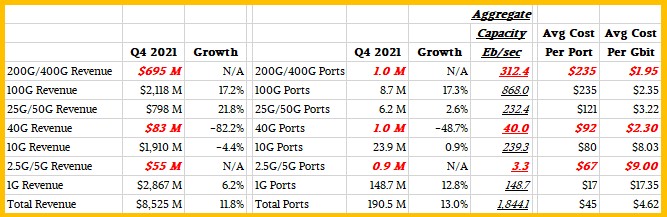
As you can see, the 40 Gb/sec Ethernet market, which was a necessary stepping stone between 10 Gb/sec and 100 Gb/sec Ethernet because materials scientists needed to do a lot of innovating to get us all the way there and could not do so easily a decade ago. For whatever reason, it seems to be getting easier to do bandwidth jumps, but the steps are relatively small all the same: from 100 Gb/sec to 200 Gb/sec to 400 Gb/sec to 800 Gb/sec to 1.6 Tb/sec over the generations. There is roughly a two year cadence between those generations.
You can also see how 1 Gb/sec Ethernet devices represent a little more than a third of revenues, slightly less than a third of ports shipped, but only about 12.6 percent of the aggregate capacity shipped. The fairly limited number of 200 Gb/sec and 400 Gb/sec switches sold in Q4 2021– we are at the beginning of the 400 Gb/sec ramp, which has only been commercially viable for the past year or so – already have twice the aggregate capacity of all of the 1 Gb/sec switches sold. If you do the math, the 200 Gb/sec and 400 Gb/sec switches sold in the final quarter of 2021 represented 16.8 percent of the total 1,844.1 Eb/sec of bandwidth sold in the quarter, and 100 Gb/sec switches represented 47.1 percent. The 25 Gb/sec and 50 Gb/sec category and the 10 Gb/sec category represented 12.6 percent and 13 percent of aggregate capacity sold, respectively.
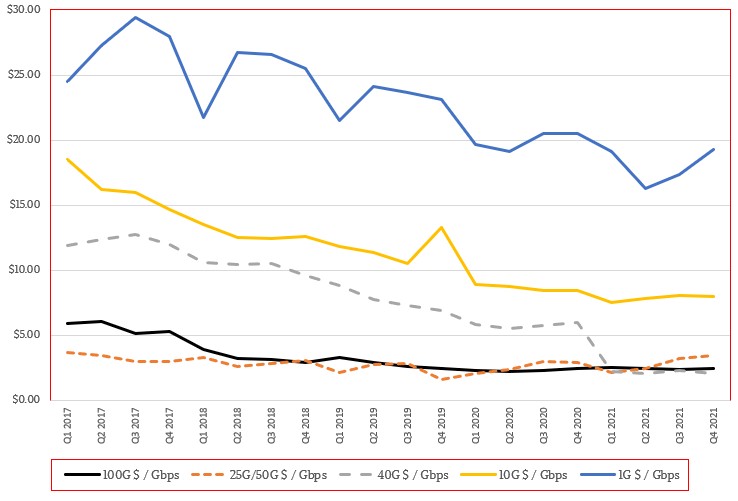
The table we have created shows the cost per Gb/sec of bandwidth, which is the driving metric for the hyperscalers, cloud builders, HPC centers, and large enterprises of the world. And indeed, as you can see, the cost per port on the fatter switches is higher, but the cost per bit is lower. And here is the trend data for port costs per bit over time from the historical information that we have gathered from IDC’s public data:
The datacenter portion of the Ethernet market buys a lot of the high bandwidth switches, but certainly not all of them. By IDC’s reckoning, datacenter customers accounted for 42.7 percent of Ethernet switch revenues, with sales of $3.77 billion, up 11.4 percent. Datacenter port counts, however, represented only 11.7 percent of the total 194.1 million ports shipped in the quarter, up 2.4 percent year on year.
The other interesting bit in the latest report on Ethernet switching and routing coming out of IDC is that Juniper Networks, which has been hanging on as a weak number six vendor, has been pushed back down into the Others category, which si the yellow ling with black triangles in the chart below:
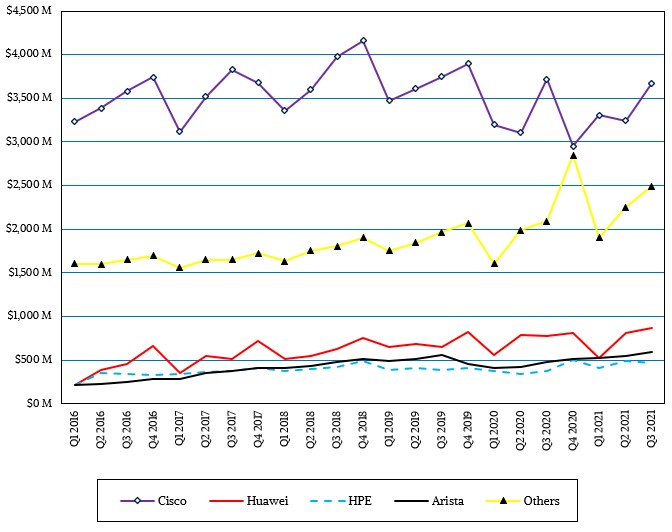
You will no doubt see that the Others category is growing pretty steadily, and that is not because of the addition of Juniper to this data, but because of the rise of whitebox switch vendors in the datacenter and at the edge, and this is being driven by some of the hyperscalers and cloud builders. Cisco Systems is still, after all this intense competition, still a force to be reckoned with, but a lot of its success is outside of the hyperscaler, cloud builder, and HPC markets. And where Cisco does have traction, it has Arista Networks, Hewlett Packard Enterprise, and Huawei Technologies coming after it.
Small wonder, then, that Cisco decided to become a merchant switch and router ASIC maker a few years back with its Silicon One effort. If it can’t sell these upper echelon customers a switch, maybe it can get a design win and they will port their own network operating systems to them and have a whitebox swiutch and router maker manufacture them. This sure beats having Broadcom and the whiteboxers just keep eating into the market share.

Datacenter Infrastructure Is Still Only Partly Cloudy
If you want to understand datacenter infrastructure and how the market for wares is changing, it helps to start with an absolute, top-down, all-encompassing view that brings together all server, storage, and switching revenues into a single bucket, eliminating the overlaps that occur when talking about these three different categories …
AMD Needs To Complete The Datacenter Set With Switching
In the past several decades, data processing and storage systems could be architected from best of breed components, and the market could – and did – sustain multiple suppliers of competing technologies in each of the categories of compute, networking, and storage. But the post-Moore’s Law era, the IT sphere …
Cray’s Slingshot Interconnect Is At The Heart Of HPE’s HPC And AI Ambitions
Whenever one company buys another, every product line, every research project, and every employee is ultimately in play. But when Hewlett Packard Enterprise bought supercomputer maker Cray in May 2019 for $1.3 billion, it really did want all of Cray. And HPE absolutely intends to make investments in the key …
Be the first to comment