

For whatever reason, it takes a lot longer to case the commercial Ethernet switching and routing markets, which is dominated by datacenter and campus use cases, than it does for the server and storage markets. Or, at least that is the pattern that we see in the public statements issued from IDC with regard to Ethernet interconnects. The market report for Q1 2021 was released recently, and we did some spreadsheet work on it to try to extract some value from this and add a little of our own.
We talk a lot about the increases in bandwidth when it comes to datacenter interconnects, and sometimes we talk about improvements in latency. But with forward error correction (FEC) being necessary to compensate for the noise in high bandwidth signaling, latencies are on the rise – just like the cost per transistor is on the rise in the server CPU market as Moore’s Law improvements have hit a wall after staggering in larger steps toward it in recent years. But for the moment at least, the Moore’s Law improvements in Ethernet switch ASICs have been improving in the 100Gb/sec and now 200Gb/sec eras, and as we enter the 400Gb/sec era, the good news is that the cost per bit transferred by these devices – which we infer from the revenue and port speeds of the switches that IDC tracks on a quarterly basis – is coming down over time and, equally importantly, is coming down with each bandwidth bump.
Without this steady drumbeat of economic improvement, switching in the datacenter would be at a standstill. No one would ever move to a new technology. Yes, bandwidth is important, but cost per bit transferred is more important – particularly for hyperscalers, cloud builders, and HPC centers. Just like the cost per unit of compute – which we calculate separately from the IDC quarterly server dataset here – has to come down or the appetite for compute would abate.
All technologies level out at some point, of course, as the cost per Gb/sec chart below, which spans from Q1 2017 through Q1 2021, illustrates so well. The slope of the curve along the X axis is not nearly as important as the height of the line on the Y axis, although both come into play when large organizations determine the technologies that they use for networking their servers and storage together.
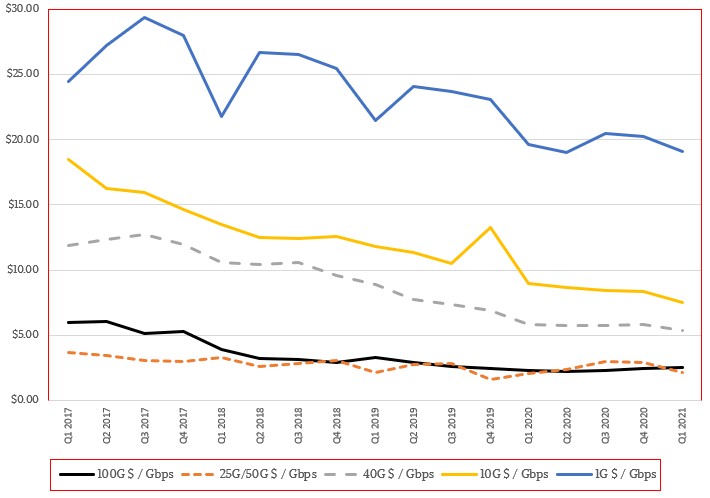
We like to see longer trends graphically because it is easier to take it in – and frankly, we wish we had a longer dataset than we have been able to build using the publicly available information from IDC. But this is what we have.
Here is a summary table we have built by switch port speed for Q1 2021, which shows the interplay of port speed, revenue for all switches sold with those port speeds, the number of ports, the aggregate capacity of all of the switches sold in the quarter, the average cost per port, and the average cost per bit moved per second. (Did we mention we love spreadsheets?)
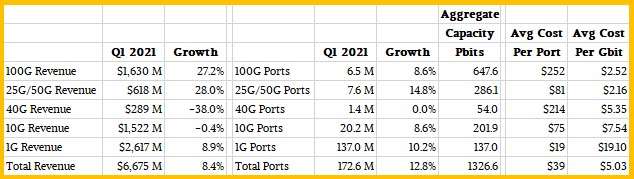
As you can see, the market at the beginning of this year was shaped a bit like a saddle when it comes to revenues, but part of that comes from the non-standard 40Gb/sec and 25Gb/sec parts of the datacenter switch market, which did not fit the normal factor-of-10 bandwidth jumps that the Ethernet networking business was able to deliver for many years. (We observe that those days are long gone, and it looks like factor-of-2 advances are going to be the order of the day for the next decade or so.) The 40Gb/sec market was a stopgap in the middle 2010s because going straight from 10Gb/sec in 2009 or so to 100Gb/sec – which really only commercialized at a reasonable price a few years ago – was not technically or economically feasible. The 25Gb/sec revolution, which includes 50Gb/sec switches with PAM4 encoding to double up their bandwidth, laid the groundwork for cheaper 100Gb/sec switches – and this has transformed the high end of the Ethernet switching market.
Six years ago, when 100Gb/sec switching was just taking off, mainly for backbones and datacenter interconnects where bandwidth is absolutely necessary, a port on these devices cost in excess of $2000 a pop. Now, the cost per port and therefore the cost per bit moved has come down by an order of magnitude. The cost per bit moved between 40Gb/sec and 100Gb/sec switches happened in early 2016, but it took two years more before the cost of a 100Gb/sec port was actually lower than the cost of a 40Gb/sec port.
Companies only add slower speeds to their networks to maintain compatibility. At some point, when the cost per bit of the new technology is significantly lower, they move to the newer stuff. And when the cost per port reaches parity between new and old technology (again, usually a couple of years later), then companies move to the newer stuff for realsies.
That said, thanks to campus networks and SMBs who do not have aggressive Ethernet switching needs, 1Gb/sec devices still dominate by some metrics – comprising 79.3 per cent of the 172.6 million Ethernet switch ports sold in Q1 2021 but still only 10.3 per cent of the aggregate 1327Pb/sec of aggregate bandwidth sold across all Ethernet switches. (That’s our math, which we did based on a model created from the raw IDC data.)
By contrast, 100Gb/sec devices accounted for 3.8 per cent of ports sold but 48.8 per cent of aggregate bandwidth, and it won’t be long before 200Gb/sec, 400Gb/sec, and 800Gb/sec devices start showing up. Switches using 10Gb/sec ports accounted for 11.7 per cent of ports and 15.2 per cent of aggregate bandwidth. Those interim 25Gb/sec and 50Gb/sec devices accounted for 4.4 per cent of ports but 21.6 per cent of aggregate bandwidth, and it is significant that these offer the lowest cost per bit moved – a little cheaper than 100Gb/sec devices – while having a port cost at this time that is only nominally higher than a 10Gb/sec port.
This is definitely a sweet spot in the datacenter, but with a new crop of 200Gb/sec and 400Gb/sec devices coming, we think 50Gb/sec and 100Gb/sec ports down to servers (using cable splitters pr hard-coded ports) will be the new normal at large scale organizations. And for certain HPC and AI workloads, the limits will be pushed to multiple ports running at full speed.
Across Ethernet switching, Cisco Systems still dominates thanks to its presence in enterprise datacenter and campus networks, as you can see here:
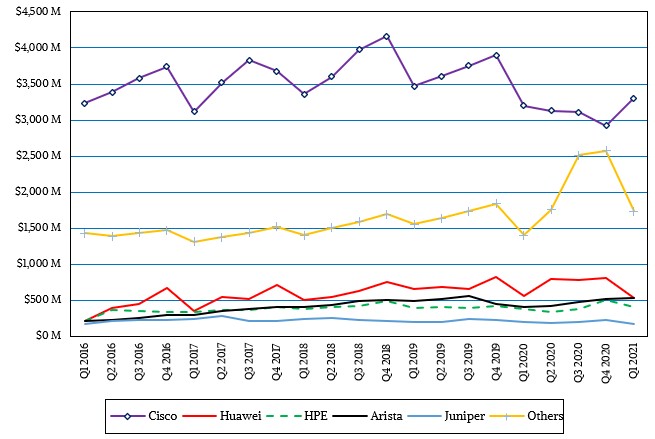
Arista Networks, Huawei Technology, and Hewlett Packard Enterprise are all vying for their piece of the pie, and Juniper Networks is still hanging in there as the number five player. Other vendors of Ethernet switches, including both OEMs and ODMs, are collectively getting a very big piece of the pie. While you can’t see it in the text data that IDC provides publicly in its quarterly reports, you can see the ODM share in Ethernet switching in this chart:
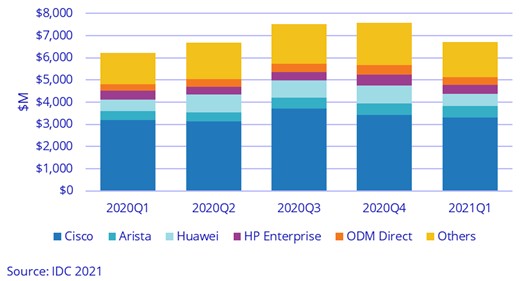
The ODMs for Ethernet switches do not have anywhere close to the same kind of market share as the ODMs in the server racket have – thanks in large part to the hyperscalers and cloud builders. While these big companies are fine with designing their own servers and storage, they are less comfortable with messing about with their networking gear. As long as the network operating system and software development kit are separated from the hardware and available for them to use and tweak as they see fit, most hyperscalers and cloud builders are fine with buying commercial switches, apparently. For now, at least. This could change.
Datacenter switch revenues, according to IDC, accounted for $2.88 billion, or 43.1 per cent of the whole market, but at only 22.4 million ports, accounted for only 13 per cent of total ports shipped in the quarter. There is a lot of business out there in the campus networks of the world – $3.79 billion and 150.2 million ports – and that is one reason why datacenter switch upstart Arista Networks created a line of campus switches to take on the hegemony of Cisco in this sector of the switch space a few years back.
Add it all up, and the Ethernet switching market is on a slow and steady sawtooth curve up and to the right, which is a good thing for the vendors who play there. The market for routers is somewhat challenged and has been relatively flat, with some quarterly ups and downs that follow server buying trends.
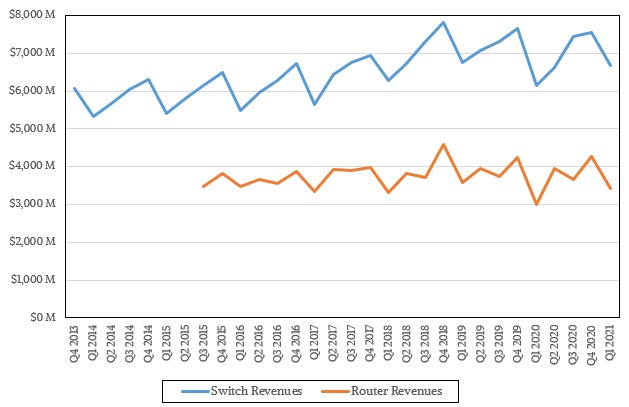
In the first quarter. Ethernet switch revenues (including datacenter and campus devices) rose by 8.4 per cent to $6.68 billion, while Ethernet router sales rose by 14.5 per cent to $3.42 billion.


Be the first to comment