

When the TOP500 list of the world’s most powerful supercomputers comes out twice a year, the top-ranked machines receive the lion’s share of attention. It is, after all, where the competition is most intense. But if people had given more scrutiny to the bottom of the list, they would have noticed something unusual happened at the end of the last decade that would have a profound effect on the future trajectory of supercomputing.
On the June 2008 list, the nearly unwavering exponential curve of performance gains represented by the slowest supercomputer on the list – system number 500 – hit an inflection point, missing its expected mark ever so slightly. In the ensuing years, it became apparent the performance curve for the number 500 system had noticeably flattened. And then people did take notice.
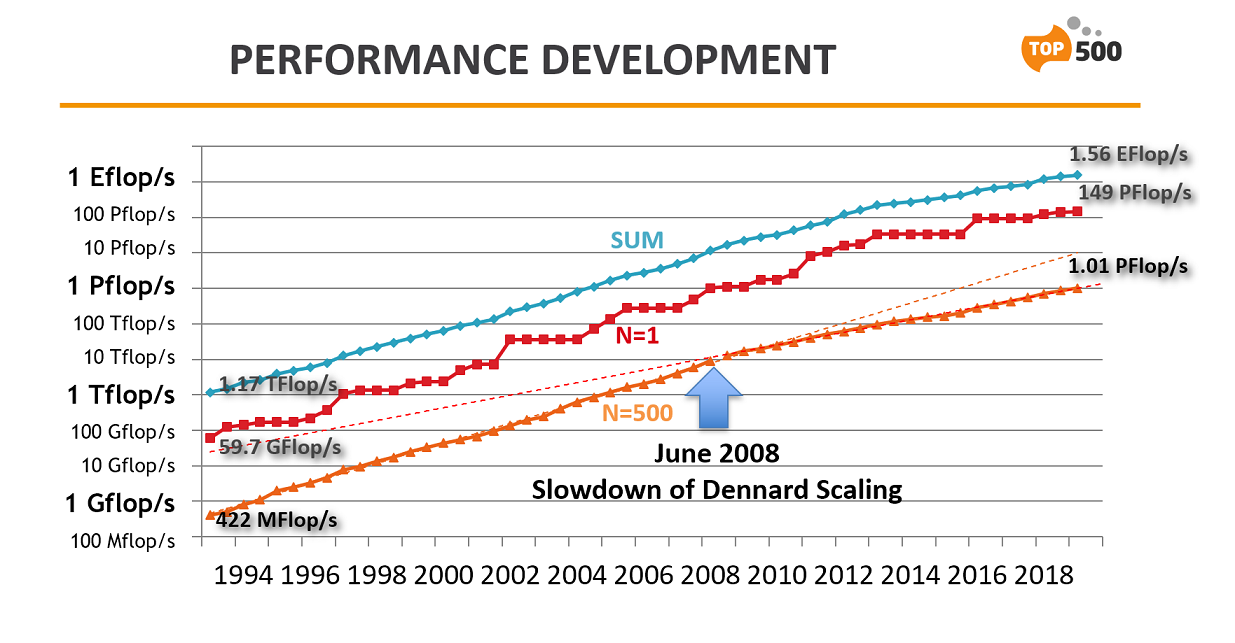
At the time, there was some talk that the performance slowdown might be the result of the global recession of 2007, which caused a retraction in government and corporate spending in the post-recession years. But the flattened performance curve persisted well past the end of the economic turndown.
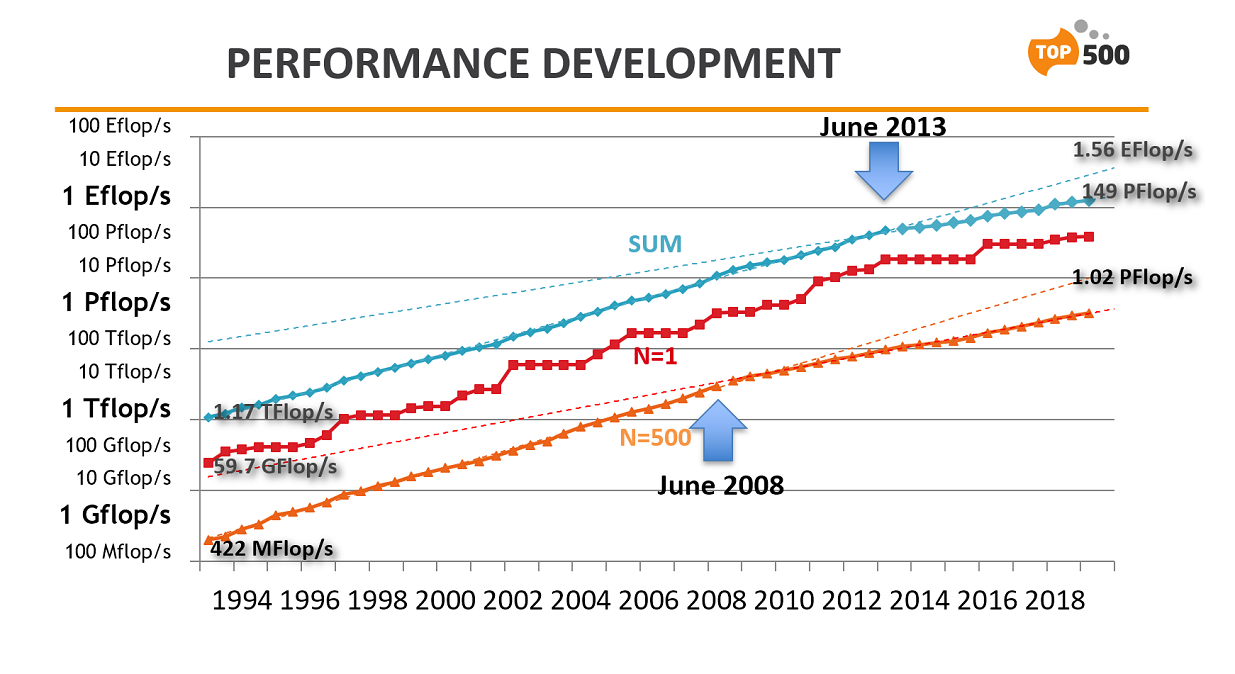
And then in June of 2013, the list’s aggregate performance curve for all 500 systems hit the same inflection point, which like the bottom-system curve, began to exhibit the same flattened trajectory. With the June 2019 TOP500 now in the books, both curves appear to point to a permanent slowdown in supercomputer performance gains. Although a bit harder to discern, even the performance curve for the number one system started to display the same flattening.
On Monday, while recapping the latest list announced at the ISC conference, TOP500 author Erich Strohmaier offered his take on why this persistent slowdown is occurring. His explanation: the death of Dennard scaling.
In layman’s terms, Dennard scaling is what enabled chipmakers to increase the clock speed of their processors without increasing power draw as transistors got smaller. Unfortunately, the physics that drove this broke done somewhere between 2005 and 2007 when transistors became so small that increased current leakage caused to chips to overheat, which effectively prevented further clock speed-ups. One rarely sees clock frequencies for CPUs much above 3.5 GHz these days, with 5.0 GHz pretty much the upper limit now.
However, Moore’s Law-style transistor shrinkage is still limping along and does enable chipmakers to put more cores on a processor, which offers additional performance from thread-level parallelism. But multicore designs are not as efficient as faster clocks for boosting performance. Going from 2.0 GHz to 4.0 GHz will reliably double execution speed; going from 2 cores to 4 cores provides something less than that for all but the most embarrassingly parallel software.
According to Strohmaier, the leveling off in processor speed impacted the bottom of the list first, since these tend to be commercial systems, whose buyers are most sensitive to lower price-performance. Such customers didn’t purchase new systems if the performance delta was not to their expectations. (And in the heyday of Dennard scaling, they came to expect a lot of free performance.) Or if they did buy a system for other reasons, they used their budget to purchase one with less performance than they otherwise would have. Thus, this part of the list showed the effect of Dennard scaling’s demise almost immediately.
“It was a real clean break,” Strohmaier told the audience. “Before and after we have very stable exponential curve rates.”
He speculated that the performance curve of the entire list of 500 systems wasn’t immediately impacted, because the aggregate performance is dominated by the largest supercomputers. These are almost always deployed at national labs and other large supercomputing centers, which purchase systems differently than commercial buyers.
As Strohmaier point out, these government-supported centers have relatively stable annual budgets, and if they can’t obtain a system with kind of performance increase they have come to expect, they’ll save up their funds for an extra year or two until they have enough money to justify buying a bigger, more performant system. So after 2008, these top-end systems tended to be proportionally larger than they would have been in the past, which would have compensated for the performance no longer supplied by clock speed increases.
Although Strohmaier didn’t specifically mention it, it’s also quite possible that the growing adoption of manycore chips like GPUs and Xeon Phi processors by many large systems during this time period filled some of the performance gap that would have been delivered by Dennard scaling. Of course, that kind of architectural shift only works once, since from a clock speed perspective, accelerators aren’t getting any faster either.
“There is no escaping Dennard Scaling anymore,” Strohmaier noted.
In any case, by 2013, even large centers had to come to grips with the fact that they couldn’t always extend their procurement cycles. One reason for this is that even for these top machines, compute speed isn’t everything. Valuable features such as memory capacity, interconnect capability, and local storage performance, are also important and are becoming more so as the application focus shifts to more data-centric workloads like machine learning and analytics.
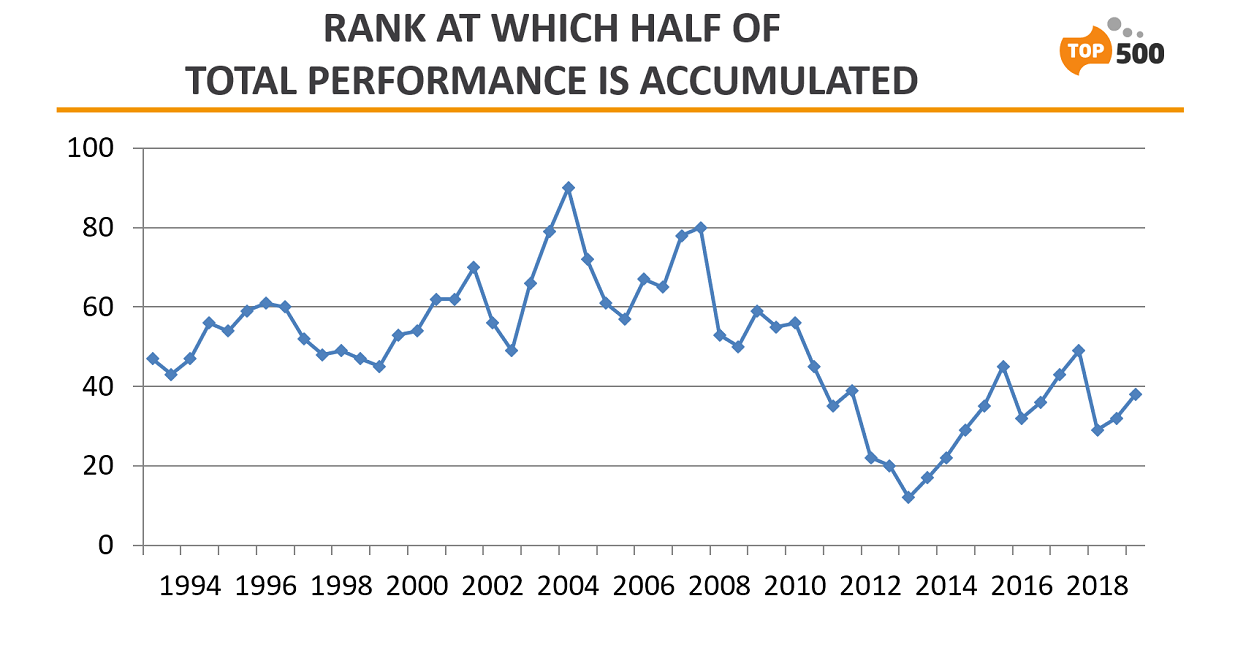
Nevertheless, the different buying behavior at the two ends of the spectrum magnified the performance differences across the list. Since the large supercomputers funded by government grew faster than the more numerous commercial systems, this dichotomy grew appreciably after 2008. The effect was that the list’s aggregate performance became a lot more concentrated in fewer systems at the top. “The TOP500 based on these two populations got more and more top-heavy, based on performance,” explained Strohmaier.
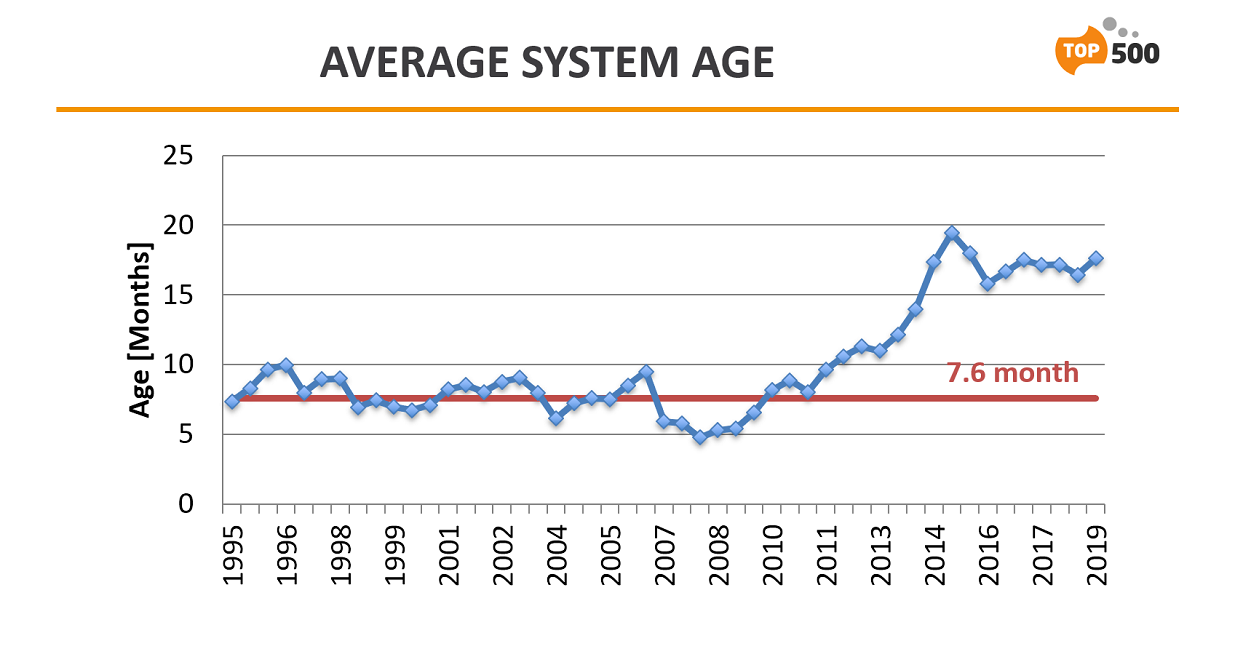
He also pointed out that starting in 2008, the average time for a system on the TOP500 list began to climb rather steadily. That was also reflected in appreciably lower turnover rates than had been the case historically. For the first 23 years of the list, the average age of a TOP500 system was 7.6 months. Between 2008 and 2013, that doubled to more than 15 months, which is where it seems to have leveled off.
So now we’re in situation where performance gains depend on some combination hardware innovation, bigger systems, and Moore’s Law. The latter is slowing fading and when it finally hits its end-of-life in the next decade, Strohmaier expects another significant hit on the performance curves. And according to him, in the absence of any new technical innovations, this time the effects will be felt immediately.

At Long Last, HPC Officially Breaks The Exascale Barrier
Significant business and architectural changes can happen with 10X improvements, but the real milestones upon which we measure progress in computer science, whether it is for compute, storage, or networking, come at the 1,000X transitions. It has been nearly two decades since the “Roadrunner” hybrid Opteron-Cell was fired up at …

Waiting – Not Precisely Patiently – For Exascale
There was an outside chance that China might pull a surprise on the HPC community and launch the first true exascale system – meaning capable of more than 1 exaflops of peak theoretical 64-bit floating point performance if you want to be generous, and 1 exaflops sustained on the High …
Top500 Supercomputers: Hungry For The Exascale Feast
Let’s just cut right to the chase scene. The latest Top500 ranking of supercomputers, announced today at the SC21 supercomputing conference being held in St Louis, needed the excitement of an actual 1 exaflops sustained performance machine running the High Performance Linpack benchmark at 64-bit precision. And because the 1.5 …
Be the first to comment