

It took a very, very long time, but if current conditions persist, we could see a server market that rakes in more than $100 billion next year.
That is a crazy amount of infrastructure, and is a reflection not only of the rising cost of machines, which are being jam-packed with expensive processors, memory, flash, and sometimes GPU or FPGA accelerators, but in the tremendous amount of computing that modern applications take and, presumably, the even larger value that organizations are deriving from these vital engines of commerce.
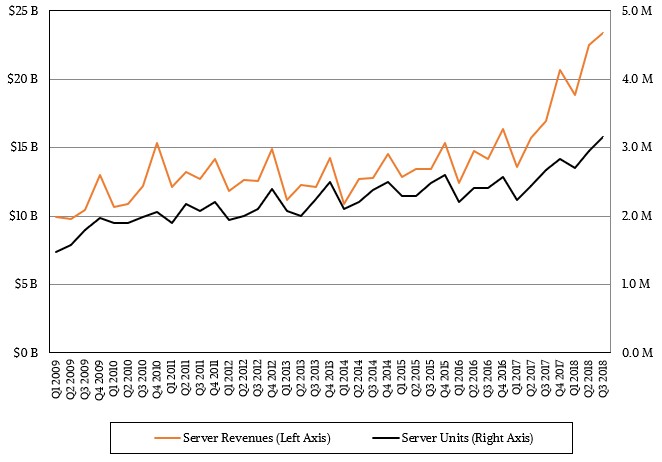
The current wave of server buying – and its drag along of switching and storage purchases – makes the dot-com boom look like a dress rehearsal. In the third quarter, IDC reckons that the world consumed 3.16 million servers, an increase of 18.3 percent compared to the year ago period, and when all of the invoices were added up for this iron, it added up to a $23.37 billion pile of cash for the hundreds of makers of machinery, an increase of 37.7 percent from the third quarter of 2017.
The market prognosticators were right that the server market would eventually explode to these levels, they were just 15 years too early in their predictions, not seeing the recessions in 2001-2002 and 2007-2009 on the horizon and the wave of virtualization that would sweep corporate datacenters, driving up utilization and driving down unit shipments and revenues. But that virtualization compaction is long since done, and now workload growth assumes virtualization for certain workloads – either through hypervisors or containers – and many key workloads that drive sales are running on bare metal still to this day.
Some historical numbers are illustrative. In 1997, when the dot-com boom really started in earnest, the server market’s revenues and shipments had more than doubled in three years, to $12 billion and 1.8 million units, respectively. At that time, X86 machinery comprised about half of overall server shipments, but made up a smaller portion of the revenue pie, which was $55 billion that year, because there was so much big RISC/Unix iron going in as the web tier and the database backends of those dot-com startups. At the time, IDC had projected that the server market would explode to $90 billion by 2003 – something that most certainly did not happen.
But it is sure happening now, and it took a major shift back to service bureau-style computing – either through the use of hyperscale applications that are free or close to it, or through public cloud infrastructure that allows people to run their own applications or those from others upon it – to make the boom go supersonic. We are now consuming nearly twice as many servers in a quarter as we did in a year two decades ago.
So what does this mean? If server shipments grow by 35 percent in the fourth quarter, then 12.4 million machines will go out of the factory doors in 2018. And that is with somewhere around 40X more compute capacity per server (roughly 2X the clock speeds, roughly 2X times the unit of work per clock for integer work, and roughly 10X the number of cores per machine. (Those are very, very rough estimates.) So the amount of compute capacity consumed in a year is more like 275X that of what was consumed during the dot-com boom, and if you account for increased compute utilization through various kinds of virtualization, it is probably more like 600X of effective capacity increase. Over that same time – from 1997 through 2018 – global domestic product will have grown by about 65 percent, against a 60,000 percent growth in server compute capacity.
Let that sink in for a moment. Server capacity is growing somewhere around 10,000X faster than the global economy it drives.
As we have pointed out before, there are a lot of factors that go into the current server boom. The increased costs in CPUs, main memory, and flash memory probably account for half of the incremental revenue growth this year, and a lot of the remainder is probably split between richer configurations with GPUs and FPGAs and the sheer unit volume increase. That doesn’t make the boom any less significant, mind you. It just shows you the real power of Moore’s Law, even when it slows down, to allow us to do the kinds of things with applications that were not even possible, much less affordable, one or two decades ago.
We live in the future.
There may be another factor in the 2018 part of the server boom. Companies, particularly enterprises that remember the lockdown on IT budgets as the Great Recession ripped through the global economy, might be buying ahead of a projected decline. A recent survey of chief financial officers by Duke University indicates that nearly half of them believe a recession will strike in 2019, and 80 percent think one will hit by 2020. Given that it has been a decade since the last recession, people are bracing for it, and economic indicators are wiggling all over the place, up as well as down, because the level of uncertainty is on the rise.
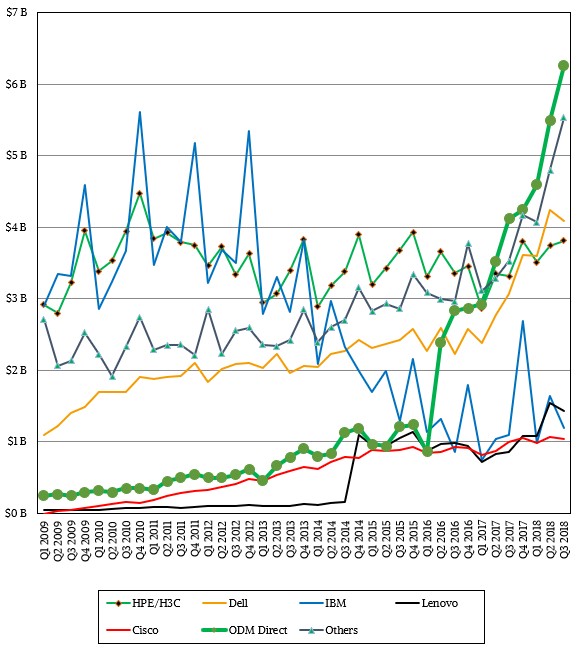
In the meantime, welcome to the boom town, and all of the server vendor boats are rising. Some faster than others. Take a look:
We like tabular data as well as graphical charts, so here is a table with the key server vendors and how they did in 2017 and 2018:
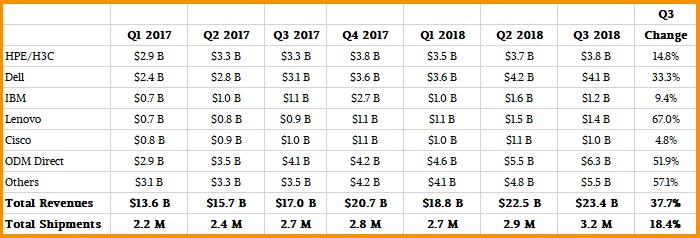
Oracle and Fujitsu no longer rank in the top five vendors, and Inspur and Huawei Technologies have broken in to compete against the stalwart incumbents such as Dell, Hewlett Packard Enterprise, IBM, and Cisco Systems and the quasi-upstart Lenovo, which bought IBM’s X86 server business a few years back and is getting serious traction now. (Just as it did a few years after buying IBM’s PC business.) Supermicro is on the rise, too. Our table above only shows the incumbents plus the ODMs because IDC has only started releasing information on the major Chinese vendors to the public, and as we go forward we will update our table. In the third quarter of this year, Inspur, including its Power8 and Power9 servers as well as its X86 and Arm iron, had a whopping 156.5 percent growth, hitting $1.71 billion in sales and knocking Lenovo out of the third ranking by revenues. Huawei is tied for fifth place, with $1.05 billion in sales, up 75.6 percent, with IBM and Cisco.
Dell is now the undisputed revenue leader in servers, and it grew a little less slowly than the market average, rising 33.3 percent to $4.09 billion in sales in Q3. HPE and its partnership with H3C in China grew at 14.8 percent, significantly slower than the market at large, to hit $3.81 billion in sales. Cisco’s UCS server business is bopping along, staying pretty close to the $4 billion annualized revenue run rate it has had for a couple of years, which is pretty good for a networking vendor that wanted to shake up system architectures. IBM had 9.4 percent growth in Q3, to just a tad under $1.2 billion, and that was due mainly to the upgrade cycles for its System z mainframes coupled to the rollout of its high-end NUMA servers based on its Power9 chips.
The ODMs as a group, who tend to make iron for the Super 8 hyperscalers and cloud builders, are on the rise as usual, with revenues growing 51.9 percent to $6.23 billion, and shipments growing 30.5 percent to 871,500 units, according to IDC. This is not all of the iron that the hyperscalers and cloud builders buy. Plenty of these companies buy iron from Dell, HPE, Inspur, Lenovo, and Supermicro as well as the key ODMs Quanta Computer, Foxconn, Wistron, and Inventec.
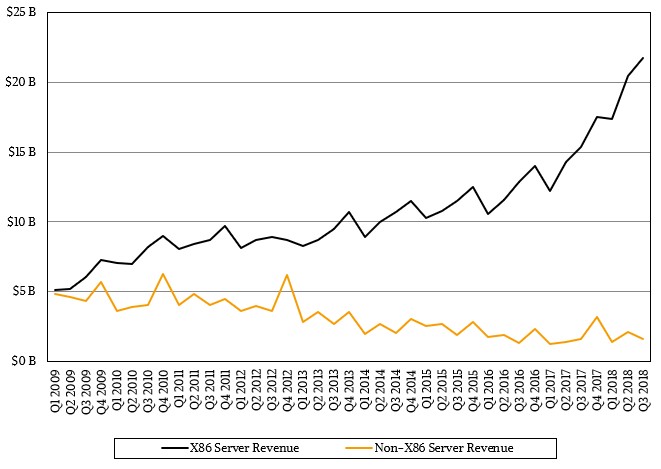
At this point, server shipments are utterly dominated by machines powered by Intel’s Xeon processors, but there is still money to be made selling other kinds of gear, such as IBM’s mainframe and Power systems and AMD Epycs and Marvell ThunderX2 Arms. But these are not yet material in the revenue and shipment numbers. All told, they are probably somewhere between 3 percent and 4 percent of server shipments. X86 iron (from all vendors and using all possible X86 processors) accounted for $21.8 billion, up 41 percent, while non-X86 iron eked out 3.9 percent growth – a factor of 10X smaller growth – to hit $1.6 billion in the third quarter.
We can’t wait to see what the fourth quarter of 2018 holds.

Will AMD Get Back Into Arm Server Chips?
There was a bit of a kerfuffle this week when it looked like AMD was changing its position a little bit on whether or not it would get back into designing and selling server chips based on the Arm architecture. The funny thing is that the world has changed around …

Ethernet Switching Keeps Rising Despite Supply Chain Woes
Whenever demand exceeds supply, inflation is inevitable. And it is not at all surprising to find that in certain sectors of the networking space, the cost of bandwidth is flattening out instead of decreasing and in some cases is on the rise. And at least until the semiconductor market settles …
Dell Gives A Second Opinion On Enterprise IT Spending
Like many of you, we are trying to find out what the heck is really going on in the global economy. And as such, we are paying particularly close attention to the original equipment manufacturers, or OEMs, who peddle servers, storage, and often switching into the enterprise. They are leading …
Be the first to comment