

The more things change, the more they remain the same — as do the two most critical issues for successful software execution. First, you remove the bugs, then you profile. And while debugging and profiling are not new, they are needed now more than ever, albeit in a modernized form.
The first performance analysis tools were first found on early IBM platforms in the early 1970s. These performance profiles were based on timer interrupts that recorded “status words” set at predetermined specific intervals in an attempt to detect “hot spots” inside running code.
Profiling is even more critical today, because instead of simple single systems, we now have clusters of compute containing multi-billion transistor pieces of silicon.
Even more importantly, you can now generate over 100,000 system profile events for a tiny portion of your software in just a matter of seconds. With ever more complex AI workloads involving sophisticated algorithms like Caffe, this can result in having to deal with billions of events. Having a software tool in hand to effectively manage massive numbers of events in a sensible and tractable manner so you can make a decision, or use a mouse pointer to “rubber band” and zoom into a specific region of your timeline isn’t easy.
Effective profiling needs a series of tiny “wins” that each add up to provide a more comfortable and exciting place for scientists to discover new knowledge. This is the name of the game. This is why we profile code, and we need it to be easier to do with a large code base on a large complex system.
Debugging and profiling, while historically useful, no longer scale.
Profiling methods now have to look at “the whole system” to be fully effective. Given that modern systems are now constructed with multiple CPU, GPU, DRAM and intricate networking components coupled with vast libraries of ever more complicated software. You can see the problem. Profiling software is so very often simply ignored due to this obvious complexity.
Teraflops of potential performance are frequently left on the table. This costs real money, especially if you are renting your processing cycles from an external provider, or if you are having to augment your systems due to a perceived lack of available performance.
However, the biggest challenge with profiling is a “Heisenberg issue”, or the “observer effect” taken from quantum mechanics, which states that the very act of observing a system inevitably alters its state.
Computational profiling is exactly the same.
The result of placing computational measurement devices inside your system will cause the system to perturb and change state. Systems are complex enough, we could really do without any of that happening.
John Stone, Senior Research Programmer at the University of Illinois, Urbana Champaign discussed his own profiling challenges yesterday at the GPU Technology Conference (GTC 2018) in his talk entitled: “Optimizing HPC Simulation and Visualization Codes Using the NVIDIA Nsight Systems”.
Stone effectively used new profiling software to look at a well regarded and stable code base and yet still achieve a speed up of more than three times.
As we’ve said, debugging and profiling are not new technologies, but what Stone managed to convince us of, was that by careful analysis of his software VMD working with real world data he was able to see over a 3x performance improvement. Stone could also provide sub second latency to his scientific user base who interact with his software.So how did they do it?
Over ten discrete steps were described in detail to achieve his ultimate performance improvements, each more subtle and nuanced than the one previously applied. Once he managed to profile the execution path of this complex software, he showed a graphical interface of what looked like a suspicious pulsating pattern of CPU and GPU load.
Every time there is “white space” in the performance graph where the processors aren’t fully utilized it shows a lost efficiency opportunity. Stone had a legitimate use case in CRYO-EM and CRYO-ET image segmentation. To segment data, you need an interactive process, and having the interactive component be able to compute and complete with sub second latency is crucial. When they started they didn’t have that capability so went hunting for bottlenecks.
First stop: they used NVTX tags to show functions in the profile timeframe. That quickly found a number of undesirable memory copies so they changed the code to fix that. Then they found CPU initialization was 30% of their watershed time. – so how to speed them up? More bogus memory copies, clearly visible in the traces with an alternating pattern of the GPU taking data, computing the answer and waiting a bit more.
Essentially a one line “mistake” in a class interface and 1 or 2 lines of code sped the algorithm by 1.4x. Still not satisfied, they use shared memory segments for further reductions of memory copies. This got them to be three times faster over their original kernel.
They were also being careful using safety checks in the code. In GUI applications, there are often competing applications, for example web browsers etc. trying to block your application access to the GPU. You need to insert appropriate barriers and check for them. To do this they replaced cudaDeviceSynchronize() with more asynchronous methods once they fully understood their datapath. They also started to be able to overlap API calls and be even more asynchronous, by using cudaMemcpyToSymbolAsync(), that got them some of the later speed enhancements. By pipelining their memory copy operations and applying them in bulk they were able to achieve further improvements in performance by removing redundancy.
In the end, they had a 3.2x speed up coming in at 0.98s, which was below their target of 1 second. Their Image segmentation is now 12x faster than any other competing system, and not only that, they can scale to multi GPU V100 Volta and get a real world latency bound application to come in at 0.64 seconds.
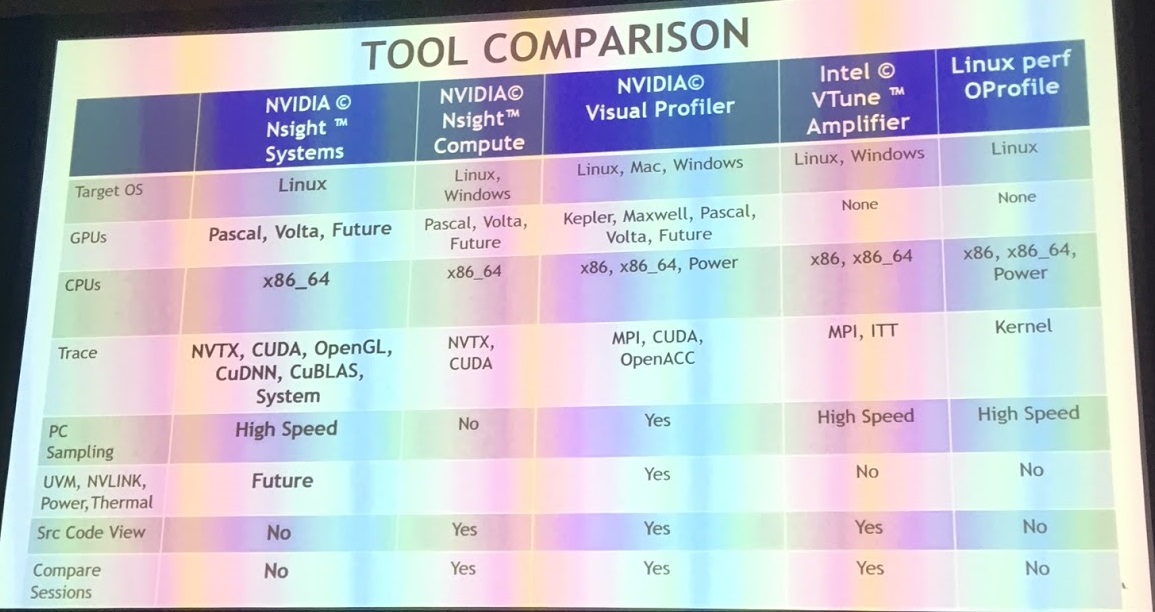
The Next Platform asked Daniel Horowitz of NVIDIA who leads the development team for Nsight Systems what was actually unique about this new software vs the existing individual “Nsight” toolkits. He said that this was the first time you could effectively profile “system wide” with their new tool. NVIDIA have a take on “whole system” profiling by combining their individual tools into their Nsight Systems package. Some are not new, but the integration of the assorted tools into “single pane of glass” with a responsive UI for millions of concurrent events certainly is.
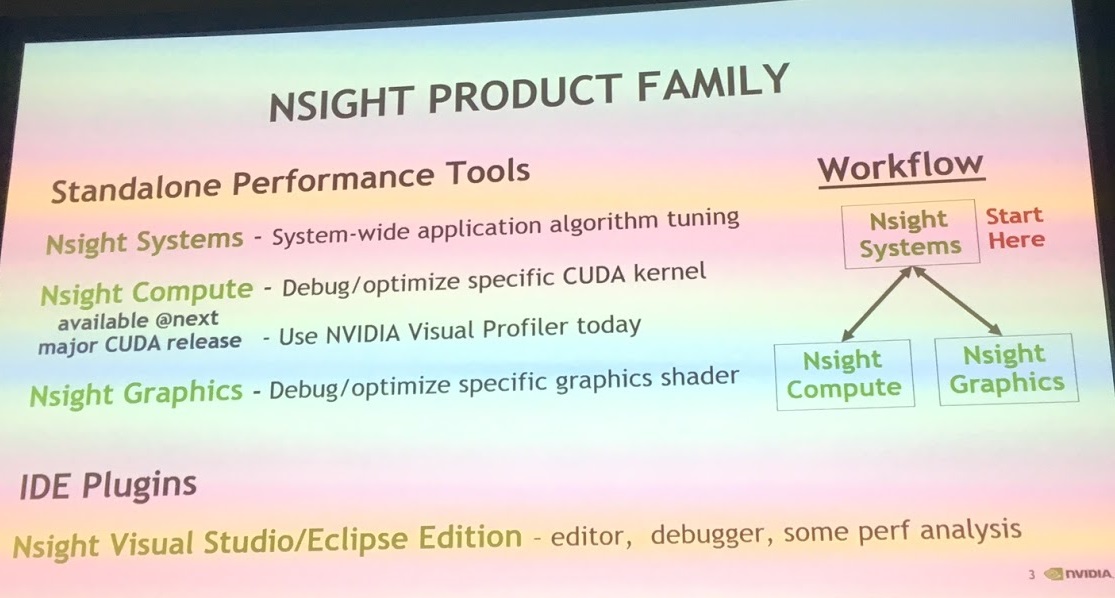
Integrating the various component parts was Horrowitz’s key goal to be able to provide customers like Stone the ability to interrogate their whole system and understand where performance improvements could be made. Currently they target only x86 hosts, with POWER and ARM architectures coming soon. The “NSight Systems” software was not available for download at the time of writing, but will be available from the NVIDIA developer zone soon at https://developer.nvidia.com.
 Dr. James Cuff
Distinguished Technical Author, The Next Platform
James Cuff brings insight from the world of advanced computing following a twenty-year career in what he calls “practical supercomputing”. James initially supported the amazing teams who annotated multiple genomes at the Wellcome Trust Sanger Institute and the Broad Institute of Harvard and MIT.
Over the last decade, James built a research computing organization from scratch at Harvard. During his tenure, he designed and built a green datacenter, petascale parallel storage, low-latency networks and sophisticated, integrated computing platforms. However, more importantly he built and worked with phenomenal teams of people who supported our world’s most complex and advanced scientific research.
James was most recently the Assistant Dean and Distinguished Engineer for Research Computing at Harvard, and holds a degree in Chemistry from Manchester University and a doctorate in Molecular Biophysics with a focus on neural networks and protein structure prediction from Oxford University.
Follow James Cuff on Twitter or Contact via Email

Building A Hassle-Free Way To Port CUDA Code To AMD GPUs
Emulation is not just the sincerest form of flattery. It is also how you jump start the adoption of a new compute engine or move an entire software stack from one platform to another with a different architecture. Emulation always involves some form of performance hit, but if you are …
Wanted: A Complete – And Heavily Customizable – HPC Software Stack
Sponsored Feature. There are a lot of things that the HPC centers and hyperscalers of the world have in common, and one of them is their attitudes about software. They like to control as much of their systems software as they can because this allows them to squeeze as much …

Programming In The Parallel Universe
This week is the eighth annual International Workshop on OpenCL, SYCL, Vulkan, and SPIR-V, and the event is available online for the very first time in its history thanks to the coronavirus pandemic. One of the event organizers, and the conference chair, is Simon McIntosh-Smith, who is a professor of …
Be the first to comment