
Cloud datacenters in many ways are like melting pots of technologies. The massive facilities hold a broad array of servers, storage systems, and networking hardware that come in a variety of sizes. Their components come with different speeds, capacities, bandwidths, power consumption, and pricing, and they are powered by different processor architectures, optimized for disparate applications, and carry the logos of a broad array of hardware vendors, from the largest OEMs to the smaller ODMs. Some hardware systems are homegrown or built atop open designs.
As such, they are good places to compare and contrast how the components of these systems work, which workloads run best on them, how much power they consume, and how reliable they are. IT administrators also can look into these datacenters to see trends that are emerging in the industry, such as whether servers with a particular number of processors are growing popularity, which hardware accelerators are being asked for or how much capacity enterprises are looking for in their storage systems. The data collected on the infrastructure itself can give businesses a window into the future direction of datacenter technologies.
It was with this idea that cloud storage vendor Backblaze almost five years ago began to keep the statistics it collected on the more than 85,000 hard drives the company manages in its datacenters, and then make that data available to the industry at large through quarterly reports that track the performance and annualized failure rates of the devices from Seagate, Western Digital, and HGST, Hitachi’s former storage business that is now a wholly owned subsidiary of Western Digital. At the same time, the company invited others in the industry to perform their own analytics on the data.
According to Andrew Klein, director of product marketing at Backblaze, before 2013 the company would collect the hard drive statistics, but would delete the information after 30 days. However, understanding the insights that could be gleaned from the information, the company eventually decided to keep it. Now, Backblaze collects data from each drive every day, in large part to determine the annualized failure rates of the devices and to discern any pattern that might emerge.
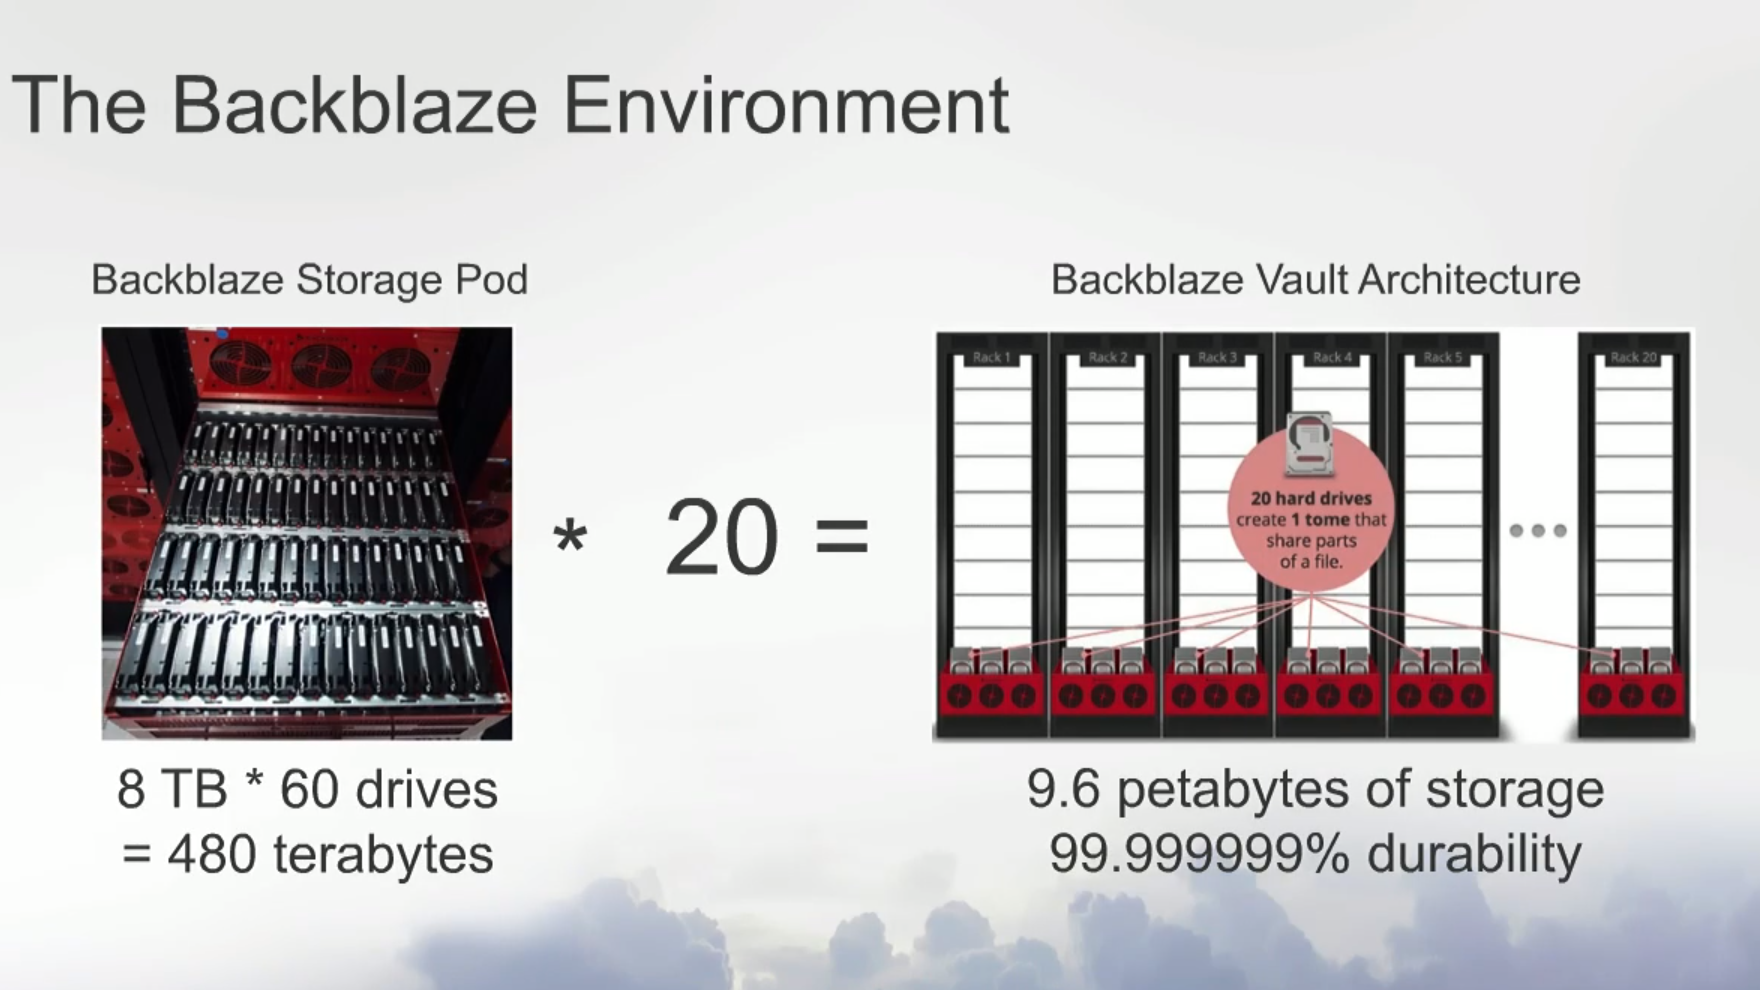
The cloud storage provider, which has both consumer and enterprise customers, stores more than 500 petabytes of data in its 85,000 hard drives, which vary in size from 3 TB to 12 TB (the 10 TB and 12 TB Seagate drives are relatively new, coming into the datacenters in the second half of last year). Backblaze’s storage environment is based on Storage Pods, which is comprised of 60 hard drives. Twenty logically grouped Storage Pods make up a Backblaze Vault.
Backblaze uses its own formula (seen below) for determining the annualized failure rate of a hard drive, Klein said during a recent presentation of the third quarter 2017 stats. If a drive runs well, it is categorized as a 0; if it fails, it drops into the failure category as a 1. Each day that a drive appears in the dataset, that is considered a drive day, so if it runs for 180 days and then fails – maybe it doesn’t spin up, it won’t connect to an operating system, or it won’t sync in a RAID array – the drive will have contributed 180 drive days toward the failure rate.

“The reason we do that is because drives are always coming and going in our systems,” Klein said. “Sometimes they fail and sometimes they come out because they’re migrated. So we took a 2 TB drive out the system after 180 days. It didn’t fail, but we don’t want to discount the fact that it contributed for 180 days of good working order. Finally, if you’re looking at something over the course of a year, drives come in, so a drive comes in in the middle of the year and only contributed 180 days or thereabouts to this. Put all of that together, put it into the formula and you get a disk error rate; that’s an annualized failure rate, and it allows us to compare drives regardless of how many days they have on them or where they are. You’ll see that some of the drives might have been only the last couple of months and we’ll have an annualized failure rate for that. Some of them may have been around for four or five years on average. Some of them might have been around for two years, and so on. This is what allows us to do that, and it’s that change in time for the annualized failure rate that we pay attention to. A drive that’s increasing its annualized failure rate over time, that’s something we’ve got to pay attention to, just like decreasing rates. Some people want to do something like ‘drive count per failures,’ but that only works with the macro number and doesn’t take into account the time.”
What comes out is a list of the different hard drive models used in the datacenter as well as their size, drive days, failures and annualized failure rate. As see in the chart below, the overall failure rate for all the drives in Q3 was 1.84 percent, consistent with other quarters. In the fourth quarter, the rate was 1.65 percent, and for all of 2017, it was 2 percent, according to Backblaze.
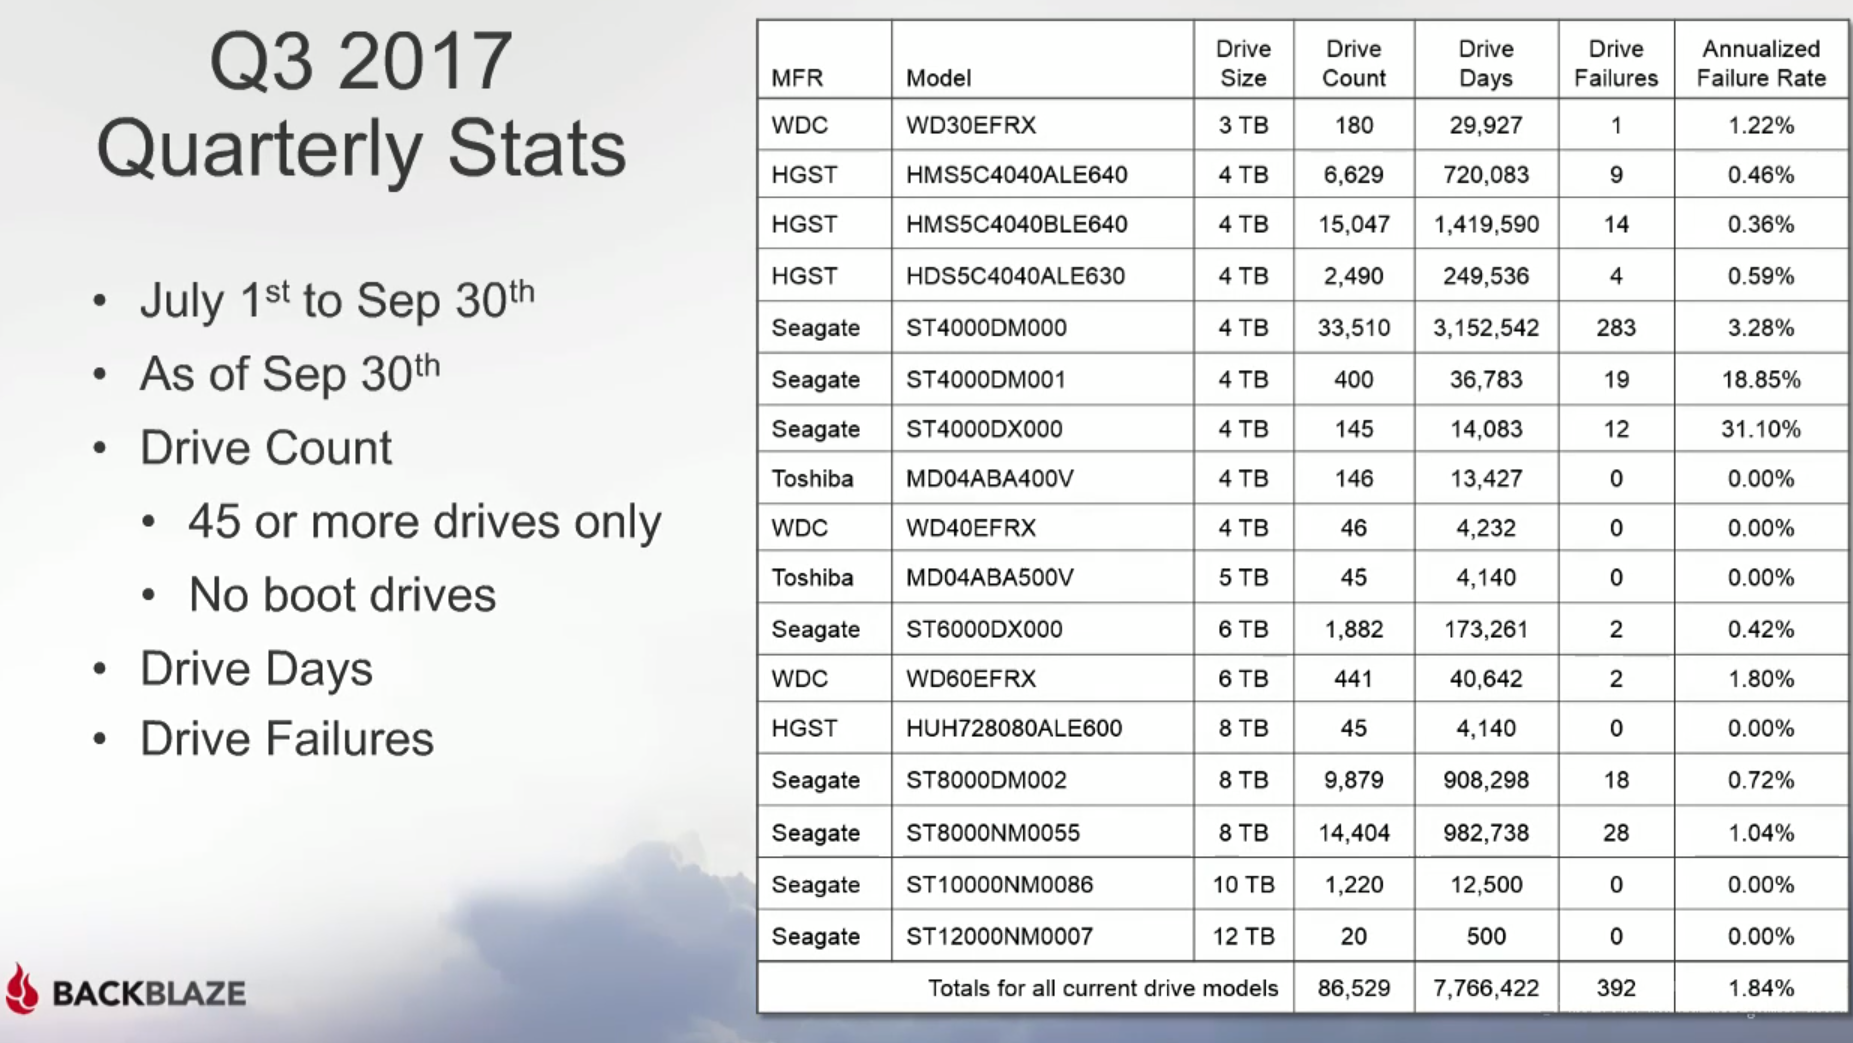
Looking at particular manufacturers, HGST had a failure rate of 0.61 percent, while Seagate was 2.71 percent. The company doesn’t have as many drives from Western Digital (though the goal is to get more into the environment soon) or Toshiba, though both had respectable rates. Anything below 5 percent is fine, he said.
“In our environment, HGST are very, very reliable,” Klein said. “The thing that has happened is that since that unit was acquired by Western Digital, they have not produced consumer drives. They’re a little more pricier than you might expect if you’re just going out and buying a hard drive. You’ll have to pay attention to that over the coming few months because HGST is now part of Western Digital and has been for a while, and they continue to march forward in integrating those two companies, so it will be interesting to see what kinds of models come out of there. But if you can find one and you like the price, they’ve performed quite well for us over the years.”

So what are the trends that the company is seeing in their storage environment? One is the increasing density as Backblaze moves away from older 3 TB and 4 TB drives in favor of larger 10 TB and 12 TB drives.
“There’s only 180 of the 3 TB drives left in the farm,” Klein said. “Over the years, we’ve had tens of thousands of them. Where did they all go? Basically, they’ve all gone to migrations. We are slowly migrating off of older, slower drives into larger drives. We took out over 4,000 3 TB drives and a little over 2,100 4 TB drives and put in 8 TB drives and so on. It’s just a storage density thing. In the case of 3 TB drives, they were getting to be four and five years old. Their failure rates, depending on the model, were really good, which is a little sad, when you think about it. You’re talking about a thing with an annualized failure rate of 0.8 percent, but you’re still taking it out. But the reality of it is that as those drives get older, they have a tendency to fail more often and it’s a density issue. If I can get twice as much data or even three times as much data in the same space, the economics are there for us to remove the drives. They serve us well, we treat them nicely, then we take them out and put them to pasture.”
Now the company is adding the 10 TB and 12 TB drives to the mix, and in a small sampling, there were no failures during the third quarter. However, there were 17 failures of the 12 TB drives in the fourth quarter, and three failures of the 10 TB drives. However, the density is key, he said. Backblaze brought up a Vault with 1,200 12 TB drives, providing more than 12 PB of storage.
However, the lack of failure early in the drives’ lives brought up an interesting question: Is there a change happening with the “bathtub curve?” A bathtub curve graph that shows that at the beginning with new drives there are early failures, and then the rate of failure settles down for a while. However, over time, those rates begin to rise again.
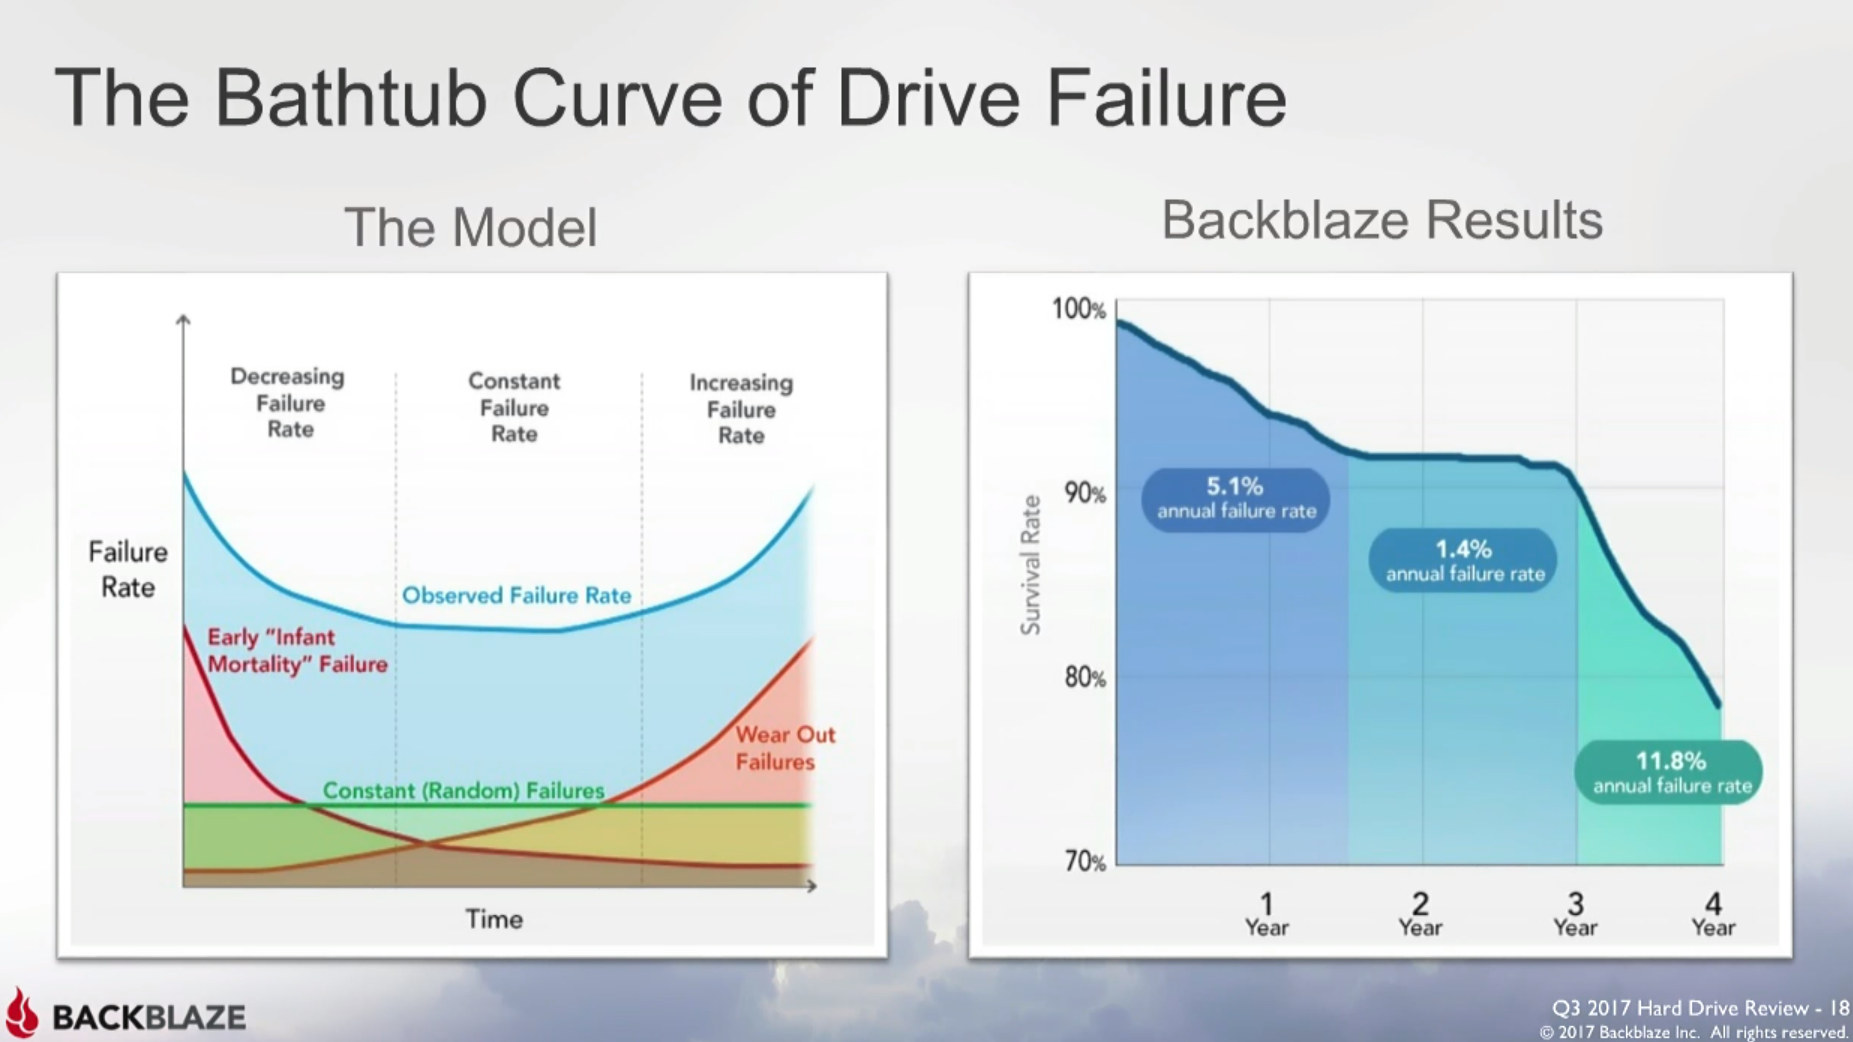
“When you put in a large number of drives, you’re going to get what is called infant mortality,” Klein said. “Some of those drives are going to fail when you first bring them up, when you go through the rigors of formatting and everything that’s necessary to set them up for RAID, so it begs the question, is the bathtub curve broken? That model seems to work with a lot of mechanical things, and it works for hard drives. But all of a sudden, we put in 1,240 brand new drives out of the box, beat them up like we normally did, and none of them failed. It’s an interesting trend to see if, one, it’s related to enterprise drives vs. consumer drives and then, two, are drives getting more reliable out of the box? Are we breaking that bathtub curve a little bit, and what does that mean long term?”
The cloud provider also has a combination of almost 10,000 consumer and more than 14,000 enterprise hard drives that it tracks in its annualized failure rate report, and they have about the same failure rate, Klein said. Seeing that, the temptation may be to buy consumer drives, which are less expensive than enterprise devices, but businesses will want to determine their needs before making the decision.
“The things that are important to us are density, cost per gigabyte – what does it cost us to do that? – and then, things like electricity and so on,” he said, adding that enterprise drives come with more protection and added features. “If you’re looking at enterprise drives, they come with a longer warranty – a five-year warranty versus a one- or two-year warranty. One thing we were able to do with those enterprise drives is tweak the power, but they do consume a lot more power than a consumer drive. We had to go in with the technology that was given to us in the firmware and change that so we could optimize it for our particular environment. They gave us those capabilities. When you’re in a consumer drive, you generally don’t have a lot of things you can play with. The enterprise drives were much faster, almost twice as fast in reading and writing. In our particular environment, that’s not an important thing because we put so many Vaults online that the ability to get data to us and store it is not constricted by the speed of the drive. It’s usually constricted by how fast you’re getting it to us. Most connections these days still can’t saturate those drives.”

When It Comes To AI, Flash Is Getting Smaller And Bigger
Sponsored We all know AI and machine learning rely on vast amounts of data, just as we all know the Internet is largely cat videos and other user-generated content no one ever looks at. Although the latter may well account for a large amount of the 6.72 ZB of data …

Why Dropbox’s Exascale Strategy Is Long-Term, On-Prem Disk
The various life-extension technologies that will keep disk at the forefront of some of the largest storage installations are working–and keeping disk’s largest consumers, like Dropbox, around for long haul… When it comes to exascale storage capacity, the national labs have nothing on Dropbox. The company’s custom-built system for storing …
Rumors of Disk’s Death Have Been Greatly Exaggerated
We talked recently about the addition of new layers of performance in the storage stack and how users and storage architects are trying to make most effective use of those. These tiers include HDD, SSDs, NVMe and storage class memory with the challenging being how to decide what data goes where and …
Be the first to comment