

If Xzibit worked in the HPC field, he might be heard to say “I heard you like computers, so we modeled a computer with your computer so you can simulate your simulations.”
But simulating the performance of HPC applications is more than just recursion for comedic effect, it provides a key mechanism for the study and prediction of application behavior under different scenarios. While actually running the code on the system will yield a measure of the wallclock time, it does little to provide an explanation of what factors impacted that wallclock time. And of course it requires the system to exist, whereas simulation can examine the performance of clusters yet to be built.
Some suites have endeavored to capture every possible factor, resulting in cycle-accurate simulations. This level of accuracy requires a lot of CPU time itself, which makes its utility somewhat reduced. At Supercomputing 2002, Allan Snavely and colleagues introduced a framework for performance modeling and prediction for HPC applications. Instead of aiming for full fidelity with real hardware, they went for a simple model, adding complexity only as needed to explain observed behavior.
In the years since, the state of the art in hardware has become increasingly advanced. The lead machine on the November 2002 Top500 List sported eight-core processors. Sunway TaihuLight, which currently holds the title, boasts a whopping 256 cores per chip. This increase in core density requires increasing memory bandwidth or else the performance gains will only be theoretical. This opens up a new avenue for the introduction of performance impacts. Other CPU features can introduce variation as well. Modern CPUs do not run at full tilt all the time. In order to reduce power consumption, many processors support letting operating system adjust the frequency to an appropriate value for the work at hand. That frequency is not always predictable, though, adding complexity to performance modeling.
Luka Stanisic and colleagues recently published a paper titled “Characterizing the Performance of Modern Architectures Through Opaque Benchmarks: Pitfalls Learned the Hard Way”. In this paper, they highlight a fundamental concept of any simulation: garbage in, garbage out. Credible performance simulations require good initialization data from real hardware. Their position is that common benchmarks are too opaque to know if they adequately capture performance variations. Since many benchmarks only produce summary statistics and discard the individual observations, more detailed analysis and verification is impossible. Furthermore, stepping through configurations sequentially makes it difficult for an analyst to separate signal from noise.
As an example of the first issue, the authors described a benchmark run they did to measure the memory bandwith. Using the MultiMAPS benchmark, they got much different results than they expected. However, MultiMAPS only reports aggregated results, which made the source of the difference unclear.
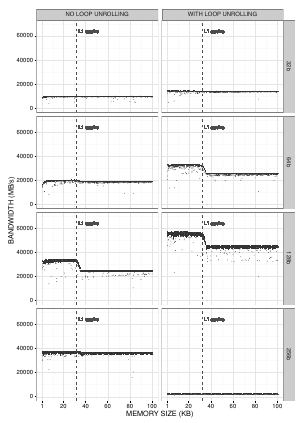
The authors reimplemented the general algorithm used in MultiMAPS and saw “enormous experimental noise” and unexpectedly small differences between the different stride sizes in the test. Further experimentation led to the discovery of two key factors that impacted the results of the benchmark test. The first factor is the type of the array elements. The original tests used 4-btye integers. Changing the type to 8-btye long long int resulted in half as many elements for an array of a given size. This means fewer accesses and thus higher bandwidth. Secondly, manually unrolling the loops in the benchmark code instead of relying on compiler optimizations produced more pronounced changes as the memory size reached the size of the L1 cache.
Sequential execution of benchmark tests can also lead to unclear results by hiding temporal events. With a real-time kernel, the authors ran memory bandwidth tests that displayed an unusual result: two modes appeared in the data across all of the buffer sizes, one with the expected bandwith and one with bandwidth approximately 5 times lower. Only when plotting the results according to sequence order did it become clear that all of the low values occurred within a contiguous timeframe. Had the tests been run sequentially instead of randomly, the results might have falsely suggested abnormally low performance for a particular configuration.
Stanisic and colleagues argue for a more transparent and rigorous approach to benchmarking. The first step is to define the experimental design, which requires consideration of which factors to measure and randomization of each factor combination. Next, the benchmark engine executes the plan and records all measurements. Only when the execution is complete are the results analyzed and aggregated. This allows for human intervention and analysis in order to identify outliers and potentially invalid results. They have made their code and data publicly available for reproduction or reuse of network and memory benchmarks.
More transparent benchmarks mean a better understanding of hardware performance characteristics. With an improved input model, simulation of application performance can become more reliable. Being able to accurately simulation applications on different platforms enables purchasers of hardware or cloud instances to optimize their performance per dollar.

Be the first to comment