

Ever-increasing Greek prefixes of flops is what makes the simulations and models of the world hum, but we at The Next Platform like money. And that is because money determines the kind and the amount of flops that people can afford to deploy to run their simulations and models. Money, or the lack thereof, is what makes architectural choices as much as any key technological factor.
With so many pre-exascale supercomputing systems being launched in the past several months – the latest being the 180+ petaflopping “Aurora” system being built by Intel for Argonne National Laboratory – it got us to thinking not only about just how far we have come in the past four decades in supercomputing in terms of the aggregate performance that can be crammed into systems. We also started wondering how the bang for the buck of the machines has changed over time.
Good luck trying to find that out.
The HPC industry does a great job tracking the performance of every architecture under the sun, and the people buying and running the upper echelon of systems certainly know what they cost to acquire, operate, and upgrade. But piecing together any sort of price/performance data over time for supercomputers is not trivial, as we discovered. We are the sporting type here at The Next Platform, if for no other reasons than to make a point and to get the industry to provide us the hard data that we crave. So in the absence of precise data, we combed through the archives and dug up pricing and basic configuration information on some of the biggest HPC iron built in the past couple of decades to see how far we are coming along on that price/performance curve.
Show Me The HPC Money
The short answer is that it is a lot easier to build a faster supercomputer than it is to bring the cost of calculations down. The good news is that the industry is, generally speaking, doing a remarkable job staying on Moore’s Law for peak raw performance, despite the engineering challenges. But these capability-class supercomputers are still exotic and expensive pieces of machinery and the cost of calculation is not falling anywhere near as fast as the aggregate performance is rising.
This makes sense. First, compute capacity will expand to consume all available budget in an HPC niche, but at the same time no system vendor is going to be so foolish as to deliver far more compute for the same money today when it knows it has to be able to sell an upgrade or a new system two to three years from now to remain in business. This is, once again, about the money, not just the flops.
Route 128, Highway 101, and a few windy roads in Minnesota, New York, and Wisconsin are littered with the hulking carcasses of supercomputing makers who did not understand this – and we have loved many of them for the brilliance of their engineering and the audacity of their business plans. HPC was perhaps the only place in IT where there was swashbuckling, at least until the Googles of the world warped into hyperscale and bent the IT sector around them like a neutron star. And that isn’t swashbuckling so much as it is an aircraft carrier coming into port, anyway. But we digress – often, and generally with enthusiasm.
Help Us Help You
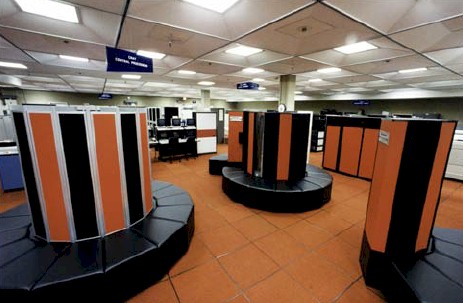
The publicly available information on the pricing of large-scale HPC systems is a bit thin, but this is what we have to work with. To get a sense of the evolution of performance and price/performance over time, we started out with the Cray 1A system installed at the National Center for Atmospheric Research. We could have gone further back to earlier IBM and Control Data Corporation machinery, but there is a limit to how much you can get done in a few hours. Suffice it to say that we know that there have been calculating machines that can be thought of the supercomputers of their day as long as there have been data processing systems that counted the money. We draw the line at 1977 because that is when Seymour Cray popularized the idea of a supercomputer and not only created a brilliant machine, but laid down the foundations of the HPC industry that we know today.
Our table ends with the IBM “Summit” and Intel/Cray “Aurora” systems that are due in 2017 and 2018, respectively, and that will deliver at least 150 petaflops and 180 petaflops, respectively. And possibly more than that if the vague statements from their makers are any guide. Summit could be expanded to 300 petaflops and Aurora to 450 petaflops, if you read the fine print in the announcements, and it is never made clear to those of us on the outside if the prices for these contracts (or any prior ones where money is mentioned) include such upgrades as a matter of course.
Take a gander at a few points on the line of four decades of supercomputing history:
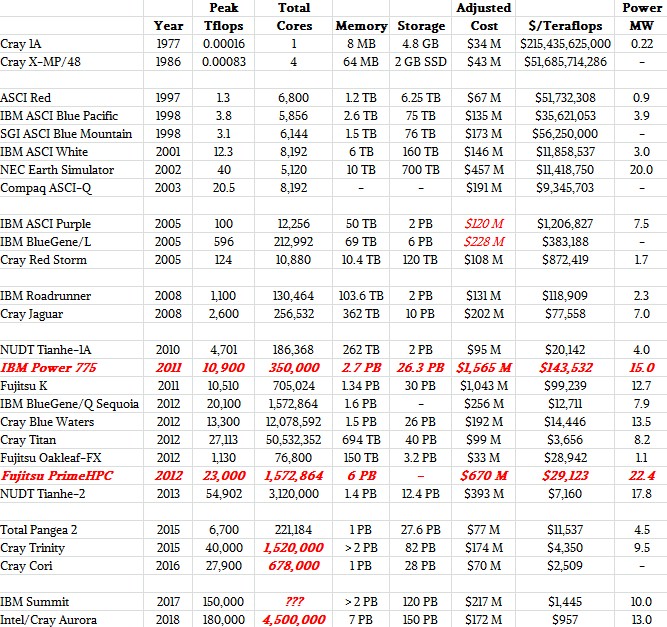
There is, admittedly, a lot of fuzzy data in this table, and it is not meant to be exhaustive but illustrative.
Frankly, as tax-paying citizens, we think government-supported supercomputing efforts and indeed any massive publicly funded projects should have their full cost available somewhere, and it should be updated as it changes, too. We used the data we could find because we wanted to get a general sense of the trends. We are aware that these contracts include services and software and other parts of the system, not just the compute elements, and we agree that it would also be useful to see what the compute, memory, interconnect, and storage all cost in these behemoths of their eras. But as you can see from the table, compute, memory, and storage all tend to scale – with very wide bars, of course, because of architectural and application differences – with each other.
Which brings us to another point we are well aware of, and that is that we are mixing data for a large number of different architectures over time and within a time. We tried to deal with some of the time factor by adjusting the costs of machines with the inflation rate in the United States, so all of the values shown in the table above are in 2015 dollars. We are using the Cray 1A and Cray X-MP/48 machines at NCAR to represent their decades, and are well aware that this is an oversimplification. But if you do the math, it surely does show you just how quickly the cost of a floating point operation came down over time. Our table shows teraflops for performance and cost per petaflops for price/performance, and this is just to keep the significant digits in the columns manageable. (The Cray 1A was rated at 160 megaflops, not zero as it shows in the chart. The Cray X-MP was around 833 megaflops as far as we can tell.)
Any items in red are estimates. The data for the late 1990s and early 2000s comes from the Department of Energy’s Accelerated Strategic Computing Initiative, which spent billions of dollars to revitalize the indigenous supercomputing business in the United States and to experiment on innovative and competing system designs. Significantly we broke apart the $290 million contract for ASCI Purple and BlueGene/L machines along the lines that make sense to us and adjusted the contract for inflation.
IBM’s “Roadrunner” built for Los Alamos National Laboratory and Cray’s “Jaguar” for Oak Ridge National Laboratory represent the late 2000s in our table. Just for fun, in the late 2000s, we put in the cost of a fully loaded Power 775 cluster at list price, and also added in a fully loaded Fujitsu PrimeHPC system. No one has, to our knowledge, ever bought either of these machines full out. We added in the feeds and speeds of the new Pangea 2 machine that was just installed by oil giant Total, and we realize that this is an all-CPU machine and a commercial system to boot with an upgrade built in.
For the most recent DOE big machines – Trinity, Cori, Summit, and Aurora – we have estimated the number of cores we think might be in the systems. There are too many variables in the Summit machines in terms of the number of IBM Power9 and Nvidia Tesla coprocessors in each system node and how many cores each might have to make a guess. Suffice it to say the Summit system will have many millions of cores spread across its computing elements.
The pricing data is a bit rough, and we realize this. In some cases, the contract price could more accurately be described as a system upgrade, not a new system. In others, the contract price shown could be for the initial system and a later upgrade – again, the publicly available information is vague and hence so is our table.
None of this takes anything away from our larger point, and that is the price/performance of these upper-echelon machines has improved dramatically over time. Take a look at this scatter graph:
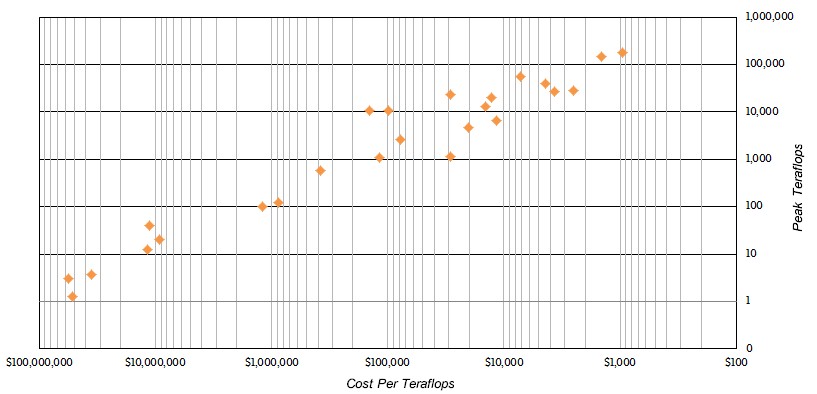
The performance between 1977 and 2018, book-ended by the Cray 1A and the Intel/Cray Aurora system, will have increased by a factor of 1.125 billion. If Aurora goes to 450 petaflops at some later date, as the Intel documents suggested could happen, then that will represent a performance jump of a factor of 2.81 billion over the Cray 1A. Not too shabby, and for those who will complain that these numbers are for peak theoretical performance, it was tough to get anywhere near 50 percent of peak on the old Cray systems just like it is tough to get close to peak performance on modern systems, even running benchmarks like LINPACK. Fujitsu’s K super hits an amazing 93 percent efficiency on LINPACK, and IBM’s BlueGene/Q hits 85 percent, but the top-ranked NUDT Tianhe-2 hybrid Xeon/Xeon Phi machine only hits 62 percent and the Cray Titan machine, which mixes Opterons CPUs and Tesla GPUs, only hits 65 percent. There are memory bandwidth issues with these hybrid machines, which are being fixed in the next-generation systems like Summit and Aurora.
What we want to talk about is the money. In the chart above, both the X axis, which shows the cost of a petaflops for each of the systems in the table, and the Y axis, which shows the performance in teraflops of the systems in the table, are both on log scales (base 10). For some reason, Excel will not allow us to add in the second set of log scale minor gridline indicators on the Y axis, but it is not on a linear scale no matter what the chart seems to say. Our point is to show that the progress on both the performance and price/performance front has been about as steady as can be expected under the circumstances.
But our larger point is that as performance has increased by more than a factor of 1 billion over the time shown in the table, the improvement in bang for the buck has improved by only a factor of 225 million. This is still impressive, mind you. But the cost of the most capable HPC systems in the world still remains fairly high.

Nvidia Enters The Arms Race With Homegrown “Grace” CPUs
There has been talk and cajoling and rumor for years that GPU juggernaut Nvidia would jump into the Arm server CPU chip arena once again and actually deliver a product that has unique differentiation and a compelling value proposition, particularly for hybrid CPU-GPU compute complexes. And today, at the GTC …
The Next IBM Platform, Revisited
When IBM announced that it was acquiring Red Hat for $34 billion eighteen months ago, one of the things we said that Big Blue needed most and would get from taking over – but not messing with – the world’s largest commercial open source software company was a coherent story …
Who Will Build Europe’s First Exascale Supercomputer – And With What, And Why?
Exascale supercomputing is just as important to Europe as it is to the United States and China, but each of these geopolitical regions on Earth has its own way of developing architectures, funding their development and production, and figuring out where the best HPC centers are to host such machines …
I like your article.
I wonder how your chart would change when you add the cost of
cooling, power, software, heroic datacenters. These have risen exponentially over the last ten years.
This is exactly the kind of information I wish was publicly available. it would be interesting to do a real TCO analysis on these massive machines.
Can you check your math, please? For the Tianhe-1A machine you quote a performance of 4.7 Petaflop at a cost of $95M, to me that makes around $20M/petaflop instead of $20/petaflop. If you can really get me a petaflop machine for $20 I am going to have a chat with my boss…
Math error not in my favor. In flipping between my teras and petas I left a factor of 1,000 in the equation. Deepest apologies to all. Fixed now. I hope.
I disagree with the comment that it was tough to get 50% of peak on the old Cray machines, or that it was similar to the difficulty of doing the same on later machines. Rather, it was relatively easy to get >50% of peak on the Crays (particularly the X-MP, which may have been the best-balanced of the Cray ECL vector machines). Performance >80% was not uncommon. I used a CFD code that ran at about 90% of peak on all 4 CPUs of the X-MP. Although it was well-suited to the Cray vector architecture, it was a real application and wasn’t all linear algebra (like LINPACK), and didn’t take a heroic effort to optimize.
On the other hand, the CMOS microprocessor-based massively-parallel systems that came later were very hard to get high performance rates out of, although they made up for it by having much higher peaks.
On the log-scale of history, this isn’t really that important, but the difference is more significant that the article implies. On real programs, the Crays could be 5-10 times better when measured by percent of peak, compared to the MPPs. It’s a shame that the ECL circuits and static RAM of the vector Crays were too expensive and power hungry to scale to the performance levels of the microprocessor MPPs, since the ease-of-programming of the Crays would have saved a lot of time and effort on the part of their users.
One of the primary reasons that the pricing for these supercomputers isn’t made public is because the vendors want to keep the pricing data proprietary. The big centers sign contracts for these machines years ahead of general availability of the systems. Of course, by the time the systems are installed and accepted, they are yesterday’s new and no one ever asks for the pricing information then. If you ask for data on systems that are no long in production, I suspect you could get rather detailed pricing broken out by hardware, services, maintenance, etc.
Buddy is right, and procurement data can be protected from FOIA requests in some cases. However the government doesn’t have to agree to these terms; the costs for some very large military weapons programs (all of which dwarf HPC investments in the United States) are known. With enough citizen or media pressure, the current practice could (and probably should) change.
Would be valuable to go back and include cost data for DoD and NSF investments as well. DoD has spent ~$1B on supers during its life, and NSF investments in HPC over the past 25 years have to be significant as well. Both agencies have had top 10 systems at various points (NSF has one now); both tracked in the Top500.
I had an emeritus professor that had his office adjacent to mine. He formerly headed a small department at a large university. At one point the university came to him and told him that he must hire a secretary. He responded, paraphrasing: “No thank you, I do all the correspondence myself and do not need one. The taxpayers of the state work hard for their money, it would not be fair to them.” When a successor took over after retirement, the secretary was hired, and the nest was feathered.
These massively parallel systems have really long set up times and rarely scale well when the applications are written as they are formulated. The SPEC HPC benchmarks are much more indicative of the application performance. Application developers complained behind closed doors that these massively parallel machines were impossible to scale past a few CPUs.
Peak numbers and the RMAX/RPEAK Linpack numbers have become the macho-FLOPS of old. These figures are mostly numbers to impress funding agencies and the public. The game became how many boxes can you get into a warehouse, and how big a warehouse can you build.
What you have now are throughput clusters, whereby my associates have found that they can farm out scalable applications to Amazon and the cloud at a tiny fraction of the cost and hassle of requesting time on these systems.
Are taxpayers are getting value from these efforts? It is time to consider whether these projects are worthwhile.
I worked at Cray Research in Chippewa Falls when the CRAY X-MP/4 came out in 1984. It had an 8.5ns clock ( that’s 117.64MHz ) ( the CRAY X-MP/2 had a 9.5ns clock ( 105.26 MHz ) ) and could produce 2 results per clock period on each of the 4 processors. The peak 64-bit floating point execution rate of the CRAY X-MP/4 was 940 Mflops/sec.