

Sometimes, to get the proper perspective, you have to take the long view. And other times, you need the extremely long view. It is with this in mind that we ponder the nature of the IT sector, the impact that the coronavirus pandemic is having on it, and prior crises that are of a similar magnitude even if caused by a different set of circumstances.
The analysts at IDC have just put out their figures for the server market for the first quarter of 2020. Given that the coronavirus pandemic was not in full swing in the three-month period ended in March, depending on how this all goes, server spending could drop more or collapse quite a bit. Or not. No one really knows. And that is why perspective really matters at times like these. As we are fond of pointing out, an economy never goes to zero, and what is quite awful often feels a lot worse than it could be if economies really did come to a screeching halt for an extended period of time. Saying this does nothing to minimize the pain that companies and their employees are feeling right now. All we can tell you is that we have gotten through bad situations before, and bad situations are always different in their own way.
We have always believed that our appetite for compute is a kind of economic indicator. It is not the normal kind of leading or lagging indicator, but more of a measure of our hopes and aspirations mixed with our need to get the normal work done. And without question, that normal has been changing and expanding over the years as the lines between personal and business use of computing have blurred. Even as Moore’s Law has made systems incredibly more capacious and incredibly less costly per unit of compute, storage, and networking, we continue to need more than Moore. And so the market grows. Even if you inflation adjust the spending data, which has the effect of ballooning spending more the further you go back in the past, it grows. (More on that in a moment.)
Before we get into the massive trend analysis we have done spanning back to 1999, which is the height of the dot-com bubble 21 years ago and which was a massive undertaking digging through the Google search engine finding ancient quarterly reports from IDC, let’s talk about what was happening right here in the first quarter of 2020.
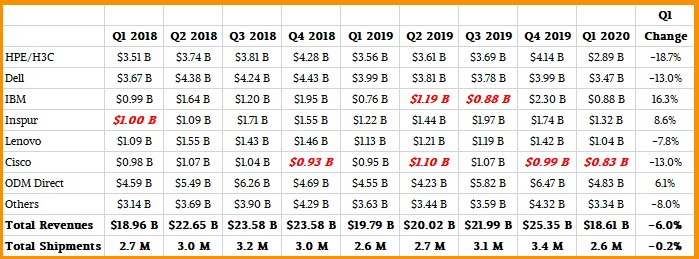
On the face of it, the numbers didn’t look too bad, but this was against a relatively easy compare, since the first quarter of 2019 was not as good as it might have been thanks to the choppy spending by the hyperscalers and cloud builders who represent somewhere around a third of server revenues and maybe close to half of the server shipments in any given quarter. Server revenues in Q1 2020 were off 6 percent to $18.61 billion, and shipments were down only two-tenths of a point to 2.58 million units. Considering what was going on in China and spreading into Europe and the United States at the time, this was not terrible. This is surprising, really. And a testament to just how dependent we all are, in one way or another, on the datacenters of the world.
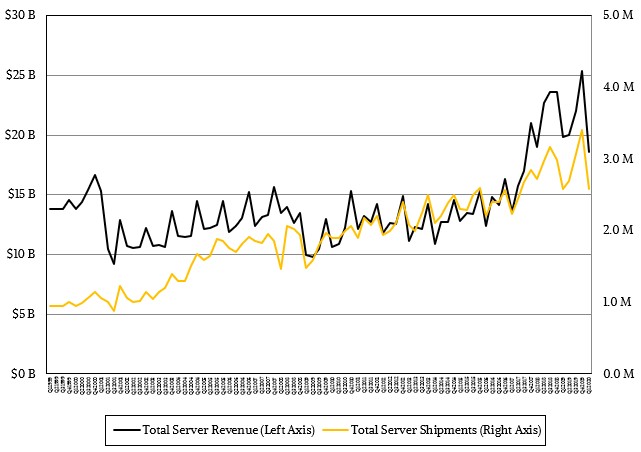
If you look at the trend since the Great Recession, as we have traditionally done here at The Next Platform, you can see that there is perhaps more drama than these numbers show. You always need to look at the sequential as well as the year-on-year data to get a better feel for what is going on. Here is what that IDC server data looks like over time:

As we have been talking about for a few years now, something different happened in 2017, and part of that was that main memory and flash memory prices went through the roof at the same time that companies started loading up some of their servers with GPUs to accelerate various workloads. CPUs got a lot more expensive too, even if they did offer a lot of throughput. Prices for memory, flash, and CPU cores have come down in the past two years, and that is reflected in the aggregated server revenues, establishing a new baseline that is somewhere around $22 billion per quarter, about twice the baseline between 2010 and 2016. Server shipments are trending upwards, gently, and also took a bit of a hook up and to the right starting in 2017.
As you might expect, the so-called volume server segment, which is for machines that cost under $25,000, was off only 2.1 percent, to $15.1 billion, according to IDC, while high-end iron costing more than $250,000 had a 9.1 percent decline to just under $1 billion. Most of that was for IBM mainframes and high-end Power Systems, by the way.
Just so you have it handy, here is the play by play in server sales by vendor for the past nine quarters by vendor:
And here it is represented graphically since the Great Recession:
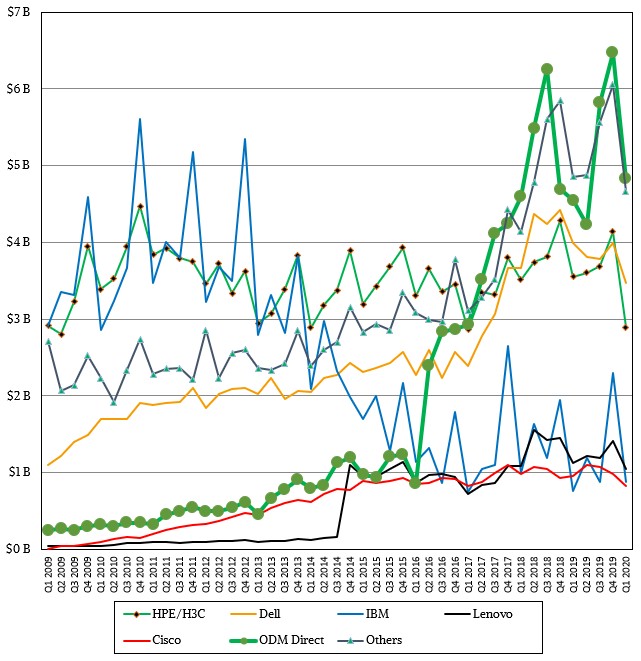
The original design manufacturers, or ODMs, who make custom gear for the hyperscalers, cloud builders, and other service providers continue their rise, but this is only a portion of the machinery these top tier companies buy. Remember, traditional original equipment manufacturers, or OEMs, who make machinery for the datacenter masses such as Hewlett Packard Enterprise, Dell, Inspur, Lenovo, and Sugon all have businesses that sell semi-custom machinery to some of the Super 8 and a few of the smaller hyperscalers and cloud builders, too. So you look at the ODM figures in the table and chart above for a sense of the growth in spending by these big companies, but not as an absolute measure in spending. Be careful not to conflate the two.
As you can see, the first quarter was a big drop for the ODMs that IDC tracks as a group from the third and fourth quarters of 2019, and the fourth quarter of 2018 and the first and second quarters of 2019 were also disappointing compared to their prior quarters. This business is inherently spikey, it looks like, just as IBM’s own business has been, as you can see in the chart above. The mainframe cycle is literally Big Blue’s heartbeat. Dell had a difficult Q1 2020 and HPE had a worse one, and there is no way to sugar coat that and it is, in both cases, largely a reflection of enterprises large and small and in between cutting their server spending when the coronavirus pandemic hit.
While we find these first quarter numbers interesting, we took the time to cast the IDC data all the way back to the first quarter of 1999 to set us up for a proper comparison if the Great Infection recession of 2020 to perhaps 2021 turns out to be on the same order of magnitude of the Dot-Com Bubble Burst and the 9/11 Recession of 2000-2001 or the Great Recession of 2008-2009. And just to be clear, creating this data set from the publicly available IDC data was a tremendous pain in the ass. We do it because we love you, and we love the truth. Our only regret is that we didn’t do this starting back in 1990. . .
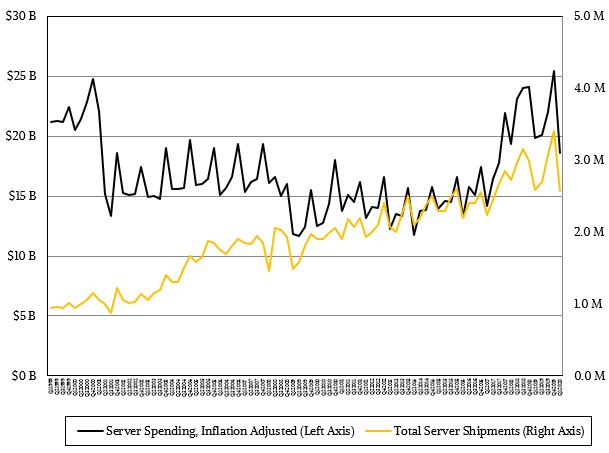
So let’s get to it. Here is the server revenue and shipment data from Q1 1999 through Q1 2020, inclusive. Our apologies for the data labels being so small on the X axis. Take a look:
If you just take this data as it is over time, it looks like the current Hyperscale and Cloud Boom is the biggest and baddest revenue generating event in datacenter history, and that the investment is so much larger than it was during the dot-com boom. It also looks like the decline from Q4 2019 to Q1 2020 is almost as bad as the one over several quarters in 2000 when the dot-com bubble burst.
There are a few things to consider there. First, the buildup in spending in 1999 was not just for the buildout of the corporate Internet, but also because of the need to buy systems to adapt applications for the Y2K date bug. Enterprises bought a lot of capacity in 1998 and 1999 for this purpose, and they were not even close to burning it off until 2002 in a lot of cases. And by then, the existing recession had been in full swing for a while and was accelerated by the 9/11 terrorist attacks in the United States.
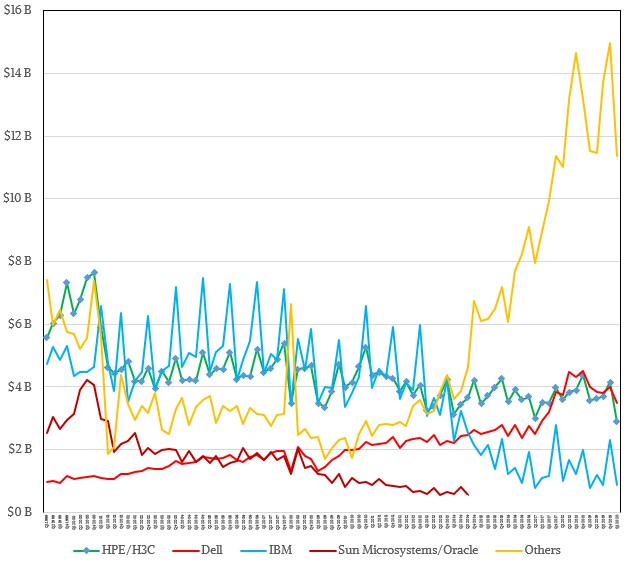
High-end server spending cycles and normal Q4 budgeting cycles drive that regularly spiking line from 2001 through 2006, which trends up and to the right slightly over that time. Shipments trend up a lot faster, and that is because X86 machinery is eating the datacenter at this time, with market share that rose from about 80 percent of machinery at the beginning of this chart in 1999 to something around 99 percent two decades later. At the peak of the dot-com bubble, Sun Microsystems and Oracle were the default configuration of server, operating system, and database for every new company, and every established company wanted to be like a startup. It got a little harder after 2001 for Sun and Oracle, but they kept growing in the enterprise. Here is a vendor chart that goes all the way back to 1999:
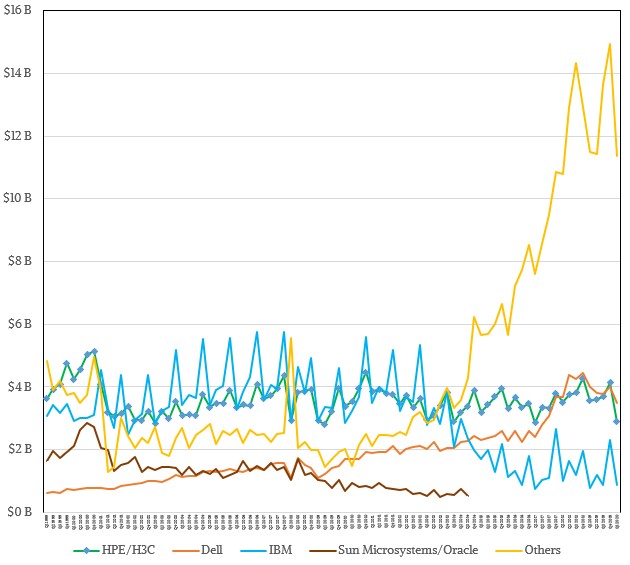
Just to make things consistent, revenues for Compaq and Hewlett Packard are combined in the chart above even though that deal was not announced until September 2001, a week before the 9/11 terrorist attacks, as it turns out. The combination of HP and Compaq was supposed to create a rival to IBM, and it sort of did, but most of the parts that made the new HP like IBM have been sold off and it is basically back down to the core Compaq server business these days. Sun Microsystems peaked and frankly disappeared from the public IDC data as others rose in prominence in the server business in the wake of the Oracle acquisition of Sun in a decade ago. The rise of steady rise of Dell is worth noting, and it has moved aggressively to rival the latest incarnation of HP, called Hewlett Packard Enterprise.
It is the Others category, dominated by other OEMs, ODMs, and weird hybrids that are now shaping the market. Individually, Dell and HPE are the biggest server vendors. But collectively the ODMs and OEMs like Lenovo, Inspur, and Sugon are getting huge swaths of business. It is a different world, and one that is difficult to adapt to.
We stared at these images above for a long time, and then realized something important. Over such long periods of time, you really need to adjust the old data for inflation. Between 1999 and 2020, the US dollar has appreciated by a factor of 53.9 percent, which is a lot. A dollar in 1999 bought that much more than a dollar does today. So we went through the quarterly data and applied the inflation rate versus a constant 2020 dollar to the IDC data for total server spending. And you can see how bad the dot-com bubble bursting really was for the server business when you do that adjustment:
Now you begin to see the proper magnitude of the dot-com bubble bursting, the doldrums after that, the repeatedly W-shaped declines of the Great Recession and its aftermath, and the rise of the hyperscalers and cloud builders. And also the very large drop, by comparison, that just happened in Q1 2020. It is about half as bad as the drop at the end of the dot-com boom, but it is happening over one quarter, not three. And, more importantly, we don’t know what the next data point is going to be.
We will know soon enough, because June is coming to a close in a few weeks.
Just for fun, and to get a better gauge of revenue over time, we did the same inflation adjustment for the major OEMs from two decades ago – IBM, HP, Dell, and Sun – against all others. Take a look at that:
This, we think, is a better measure of the relative strength of vendors over time. It still is not a good situation for the OEMs, mind you. And they are having a tough time generating profits even when they can generate revenue.
As part of this exercise, we also took our aggregate server capacity and server price/performance index and cast it all the way back to 1999. As a reminder, this takes the number of servers shipped, the average number of sockets across the market, the average number of cores per socket, and the relatively performance of a core to come up with an aggregate performance sold each quarter. (This is important: This is a sold by quarter metric, not an aggregate installed base metric.) We then dived that into the revenue generated by that capacity to come up with a relative value of server capacity metric. Here are those two curves, plotted out with inflation adjustment on the server revenues all the way back to 1999:
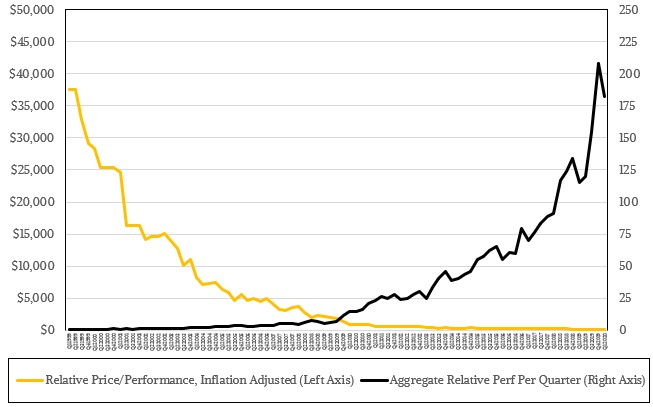
Those are two of the prettiest exponential curves you ever will see. This illustrates a bunch of things, but foremost, it has been harder to get the price/performance of capacity to improve than it has been to sell more capacity as time has gone by. By our math, the performance sold each has increased by a factor of 323X comparing Q1 1999 to Q1 2020 – the number would have been slightly higher if Q4 2019 figures were used because unit shipments were down by quite a bit, but were compensated for somewhat by having more cores in systems, we think. (This chart is largely educated conjecture. We understand that.) And after inflation adjusting the revenues each quarter, the relative price/performance has improved by a factor of 368X. This is another way of saying that spending on servers is, relatively speaking, pretty constant at the endpoints of all of these lines. But in the middle of these curves, it waned as gauged by inflation adjusted currency.
What is interesting to us is that just as we were getting back to a server market with the strength of the dot-com boom, COVID-19 might com along and pop this bubble. We shall see. With the world being ever so much more dependent on computing, we think any server recovery, should there be a decline, will happen much faster than for other kinds of capital equipment.

Hyperscalers And Clouds Switch Up To High Bandwidth Ethernet
The hunger for more compute and storage capacity and for more bandwidth to shuffle and shuttle ever-increasing amounts of data is not insatiable among the hyperscalers and large cloud builders of the world. But their appetite for is certainly always rising and occasionally voracious – even when facing a global …
The Third Time Charm Of AMD’s Milan Epyc Processors
With every passing year, as AMD first talked about its plans to re-enter the server processor arena and give Intel some real, much needed, and very direct competition and then delivered again and again on its processor roadmap, it has gotten easier and easier to justify spending at least some …
Intel Needs To Engineer Its Financial Future
Somewhere nearly a decade ago, we made a joke when looking at the rise of the hyperscalers and cloud builders. Here is the joke: “We used to worry about there only being ten vendors who supply servers, with most of the revenue being generated by two, maybe three, of them, …
On my estimate Xeon Scalable in all Skylake forms, on full run channel inventory volume, currently ranges 112 M to 145 M units of production. Range high 145 M units is determined on E5 46xx v2 28 M unit Upgrade Monkey supply signal key. Range low is determined on Scalable channel volume averaged across IB v2, HW v3, BW v4 full run volume determined on same Upgrade Monkey supply signal key. Comparing Scalables in relation an 18 month 110 M Core Skylake desktop run delivers in same volume range.
Epyc volume in 2019 adds approximately 1,362,885 units plus another 4,351,508 Threadrippers. In 2018 1,097,937 Epyc units plus another 5,697,625 Threadrippers.
IDC 20 M annual server unit volume is only meaningful to the OEM/IDMs suppling said server shipment data, on a methodology this analyst suggests is flawed not taking into account total Xeon CPU volume. Server share is ambiguous and not exactly the method on which verse Intel Xeon CPU share can be determined including meaningful to product, supply, finance and investment markets. Server in reality appears a small pond.
There are a couple ways to look at this;
At 145 M units over three years, I’ll round up to a total of 180 M units of Scalable averaging 60 M Xeon annually as the data is still coming in; Scalable full run volume peaked just this week at 46% of v4 back on October 27, 2018, then / IDC 20 M servers per year = 1 2P sled and its in rack control plane processor. This begins to make some sense on Intel’s Scalable reservation strategy beginning to supply Xeon for demand rather than supply traditionally relied to hold OEM/IDM and supply channels on volume monopolizing supply chain financially.
Alternatively, on 1,511,873,730 units of v2, v3, v4 produced calculated on the same Intel supply keys / 6 years (2013 through 2019) = 251,978,955 units annually / by historical Intel and IDC 20 M annual server statement suggests just more than 5 2P drawers plus 2 control plane units per rack; makes a lot more sense. This analysis does not take into account Xeon control plane in network switching and communications.
Analyst recommends verse Xeon share, or commercial or server share, be determined on processor volume as a more accurate measurement of market share in relation the ambiguous server method.
Mike Bruzzone, Camp Marketing