

The “Broadwell” generation of Xeon processors debuted a month ago, and now that the basic feeds and speeds are out there, customers are trying to figure out what to buy as they upgrade their systems and when to do it. This being a “tick” in the Intel chip cadence – meaning a shrink to smaller transistors instead of a “tock” rearchitecting of the Xeon core and the surrounding electronics – the Broadwell Xeons snap into existing “Haswell” systems and an upgrade is fairly straightforward for both system makers and their customers.
It all comes down to math about what to buy and when to buy it in the cases of a tick upgrade, and with the “Skylake” Xeon E5 v5 processors not expected until late next year, there is no need to hesitate on plans for buying new systems or upgrading existing ones. But with such a broad and deep product line, as we have previously detailed, and a wide variation in price/performance across that line, as we have calculated across the past six Xeon generations, IT managers have to get out their Excel spreadsheets to do a little calculating to figure out what configurations will give them the best value in their shiny new systems.
The two-socket Xeon server is the workhorse of the datacenter, an with every successive generation of Xeon processors that come out from Intel, the chip maker crams more cores onto the die and also jacks up the performance of the cores. The single-threaded performance on integer work tends to go up between 5 percent and 10 percent with an architecture change, and the core counts tend to rise enough to get somewhere between 20 percent and 30 percent more work through the chips with a reasonable amount of tuning. On some workloads, such as floating point math, changes in the vector units over the years have allowed performance to make much larger jumps, to the point where a pair of Xeon chips can be reasonably used as the exclusive compute engine for workloads that are not embarrassingly parallel or are more sensitive to clock speeds.
That extra computing oomph that comes with a new Xeon family can be used in a number of different ways. “In the past, enterprises would swap out 25 percent of their machines every year and sometimes waterfall the older boxes down to do something else in the datacenter,” Frank Jensen, performance marketing manager at Intel, tells The Next Platform. “But now, we are starting to see faster refresh cycles.”
In some cases, customers just take the extra performance and build out their clusters by keeping the node count more or less the same or perhaps increasingly it slightly. In other cases, where the customers are constrained when it comes to power or space (or both), they will use the extra performance in a single node to cut back on the number of nodes in the cluster while at the same time boosting the performance of the overall cluster to suit their needs. We happen to think that some of that spare compute capacity will be used for network function virtualization and software defined storage, workloads that until now have resided on specialized hardware appliances. (This is certainly happening in the telco space and has long since happened at the hyperscalers and the biggest cloud builders.)
The point is, with every new Xeon generations, the options get better and the means to consolidate workloads onto fewer boxes or to radically expand the performance of a fixed cluster footprint. Jensen has done a lot of math to help customers assess the options, and shared his data with The Next Platform so we could share it with you.
As a baseline, you should review the Broadwell product line and the very rough price/performance analysis we did in the wake of the announcements. There are hundreds of Xeon variants that have been created in the past seven years, and the performance gains and relative value of the raw compute across those SKUs and generations does follow some patterns. For Xeon chips with a high core count, the performance has risen steadily and the cost per unit of performance initially came down fast but the rate of change tapered off as the cost of adding cores and the desire to have lots of cores by hyperscalers increased. For the more standard SKUs, performance has increased at half the rate as the chips with the high core count, but price/performance has improved steadily. For Xeons with high clock speeds, improvements in the instructions per clock and modest increases in clock speed have resulted in faster chips, and the price of a unit of performance came down very fast with the “Sandy Bridge” generation in 2012 but has only come down a smidgen over the past two generations. Again, attesting to the fact that it is difficult to crank up single threaded performance and that those customers in the HPC and financial services arenas that need fast threads will pay a premium for that particular flavor of performance.
Here is how Jensen thinks a private cloud based on server virtualization might play out for a customer with three racks of servers using the Sandy Bridge Xeon E5-2690 processors, which have eight cores running at 2.9 GHz, and moving up to the new 22-core Broadwell Xeon E5-2699 v4 chip, which runs at 2.2 GHz:
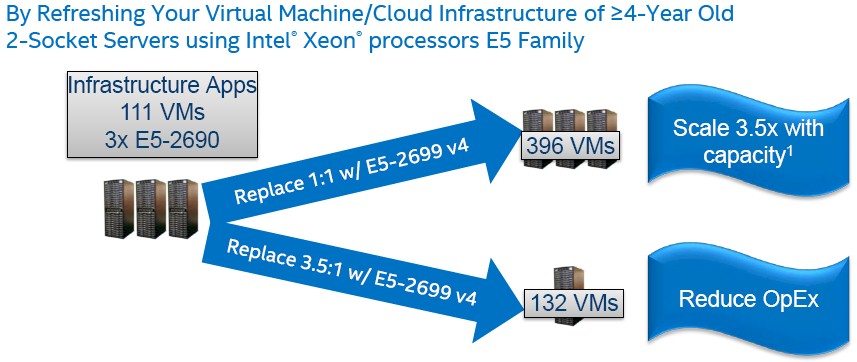
Based on SYSMark benchmark tests, three racks of two-socket machines could host about 111 virtual machines, according to Jensen, and by doing a simple one-to-one replacement for the servers to that top-bin Xeon would scale the cluster by a factor of 3.5X to around 396 virtual machines. By doing such an upgrade, customers would be giving Intel (rather than the server maker) a much larger portion of the budget, since these new Broadwell E5-2699 v4 processors cost more than twice as much a pop as the Sandy Bridge E5-2690s did four years ago. (That’s $4,115 for the most capacious Broadwell compared to $2,057 for the top-bin Sandy Bridge.) But it means spending less on memory, disks, enclosures, power supplies, and so on to get a certain capacity of compute, too. Customers will have to give up a little clock speed per core (about 24 percent) by moving to the heavily cored Broadwell.
While Jensen did not provide the economics for the comparison above, it will obviously be a lot cheaper to buy less than a full rack of machines to support 132 virtual machines in the lower scenario and get a modest 20 percent or so performance boost in the cluster.
Jensen put some numbers on a much smaller virtualized configuration pitting Sandy Bridge iron against Broadwell iron, however. This one is also for a virtualized workload, based on VMware’s ESXi hypervisor:
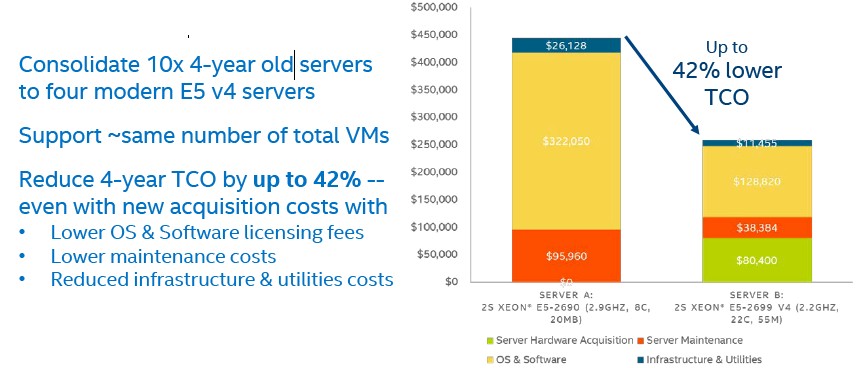
And here is the underlying data for that comparison, which was based on pricing for hardware and software effective in February ahead of the Broadwell launch:
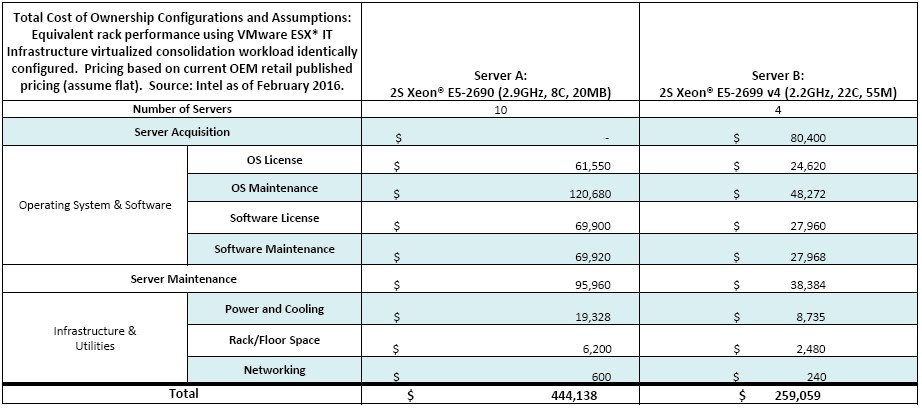
In this example, ten of the two-socket Sandy Bridge servers are being replaced by four of the two-socket Broadwell servers, both using top-bin parts. The Sandy Bridge hardware is already paid for, but annual operating system and virtualization software licenses are still applicable on the machines and so is server maintenance and various space, power, and cooling costs also accrue to the old iron, too. While it costs $80,400 to buy four of these top-bin Broadwell machines, because the server node count is reduced by a factor of 2.5X (and the performance of each nodes should be about 3.6X higher), the software license and maintenance costs are cut by more than half, and so are the other operational costs. So the net-net is that shelling out money for new hardware can save $185,079 in licensing and operational costs while also boosting the throughput on the cluster by about 43 percent.
This is the kind of math that the hyperscalers are doing all the time, and that is why Intel is making 22-core Broadwell chips and will be making 28-core Skylake chips.
Not everybody wants to pay top dollar for compute, so Jensen worked up another total cost of ownership example pitting two different Broadwells that are lower down in the SKU stack against each other. Take a look at the comparison chart, which compares ten servers using 14-core chips to eight servers using 18-core chips, which have roughly the equivalent performance:
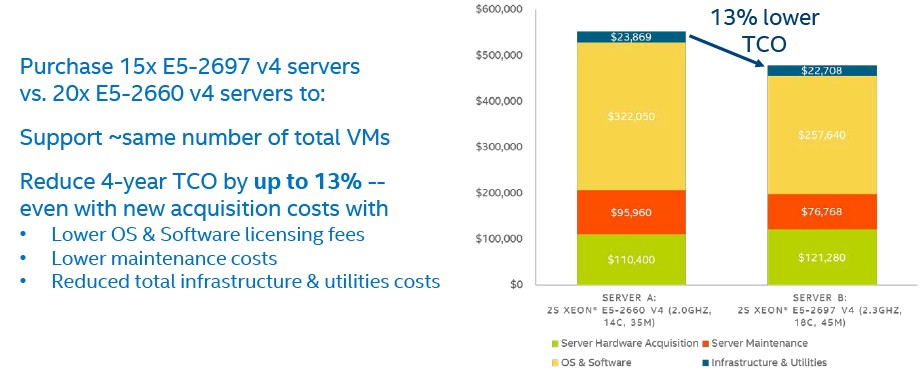
Here is the underlying table of numbers for that chart:
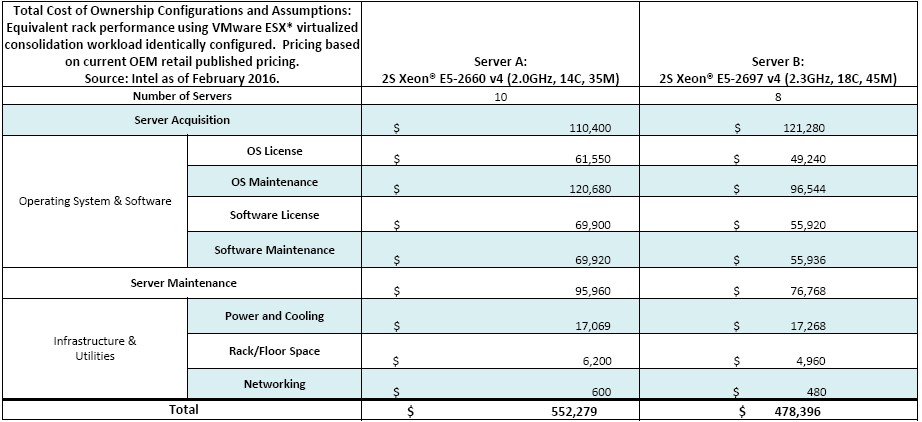
Again, each server is a little more expensive, but the software licensing and maintenance costs go down because those are based on server units (in one fashion or another) and not on the performance (where core count is a rough proxy) of the machines. In the cast above, the cores on the faster machines run 15 percent faster and there are 144 of them compared to 140 in the ten servers on the left, so this buying decision is a no-brainer. It makes far more sense to buy the machines based on the Broadwell E5-2697 v4 processors, and over the course of four years will save $73,910 in total costs, or about 13 percent.
The other thing that Intel wants to encourage companies to do – and we have a hard time believing that they do not do this already – is to fully populate the sockets in the Xeon servers. The incremental cost of that extra processor is negligible, and once you burden it with an operating system and compilers the price/performance of the machine with two sockets populated is far better. Take a look:
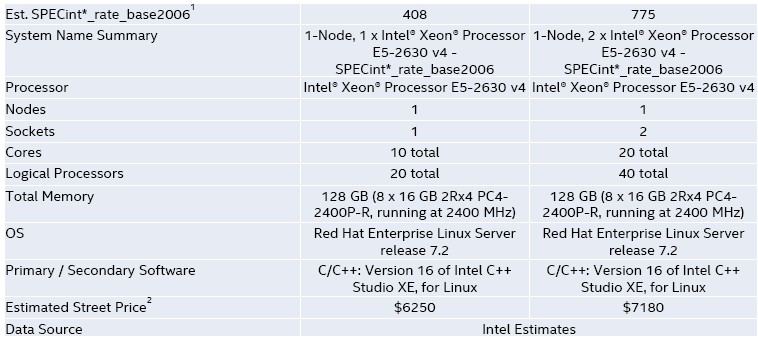
As you can see, it only costs $930 to add the second ten-core Broadwell E5-2630 v4 processor to the server above. Intel did not double up the main memory, which it probably should have. That might raise the price another $2,000 using 32 GB memory sticks. Even still, that is nearly twice the performance for about 50 percent more money.
In general, in case you have not gotten the message, Intel wants to sell you two of its fastest processors for your new servers. Period. But it will be happy for you to buy chips with fewer cores and more of them, too, if you have your reasons for going that way.
Here is another handy general guide to compare across the Xeon generations by workload that Jensen put together:
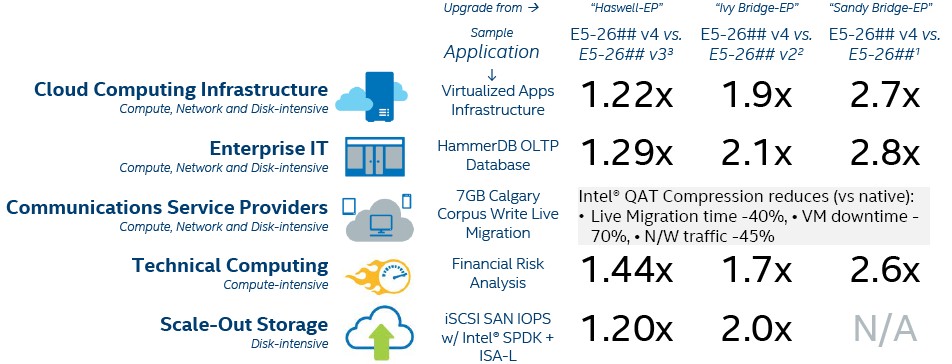
These numbers jibe, more or less, with the more generic relative performance ratings that we cooked up in our Nehalem to Broadwell analysis from a few weeks ago. Performance gains will vary by workload, as you can see. But clearly Sandy Bridge machines that are four years old will see a substantial benefit even if they stay in the same rough SKU band, which is what this table is showing. There is less of a technical incentive to upgrade “Ivy Bridge” machines from three years ago and even less of one to upgrade from “Haswell” systems that might only be a year to a year and a half old at most customer sites. The delta in performance for Broadwell compared to these machines is not enough to compel customers to move, and even the hyperscalers do not and cannot replace all of their machines with every Xeon product cycle.
No one is rich enough to do that. Not even Google or Microsoft or Amazon Web Services or Facebook.

Another Crazy Idea: Intel Might Buy Globalfoundries
Back in March, when we wrote up Intel’s Integrated Device Manufacturing 2.0 strategy put forth in the vaguest of terms by then-new chief executive officer Pat Gelsinger, we quipped that Intel might be wishing as it launches Intel Foundry Services that it had some of its older fabs around with …
The Highly Profitable Chip Making Monopoly Called TSMC
When Taiwan Semiconductor Manufacturing speaks, the datacenter sector of the IT industry listens because, with few exceptions, this foundry etches the compute, networking, and storage engines that power the datacenter. And the rest of the entire IT industry also listens, particularly the smartphone industry and a good portion of the …
Covering All The Hardware – And Software – Bases With IPUs
Sponsored Feature Over the course of two decades, Intel drove the most important architectural change in the datacenter since the advent of the System/360 mainframe in the 1960s and the rise of RISC/Unix servers in the 1980s. And that was the creation of the general purpose X86 platform, a universal …
This story perpetuates the charade Intel is playing on consumers. This is evident by the Sandy Bridge E5-2690 v1 vs Broadwell E6-2699 v4 comparison. The first table shows a consolidation of 10 to 4 servers saving 60% when eliminating the v4 server cost – note it is a 60% reduction in servers as well. The 10 servers each use 2 x E5-2690 v1 processors and each socket has 8 cores per chip totaling 160 cores. The 4 servers each use 2 x E5-2699 v4 processors and each socket has 22 cores per chip totaling 172 cores.
What isn’t highlighted in the story directly is the clock frequency of the Sandy Bridge processor is 2.9 GHz while only 2.2 GHz with the Broadwell chip. I’ll state the obvious. Why isn’t Intel building a chip so it can run at the same frequency as the previous generations where consumers can not only consolidate servers but also reduce cores? They have cores at higher frequency but lower core count and without the core density they are unable to achieve the aggregate performance needed to match the perf in the outgoing solution due to the perf per core being flat. 160 SB-EP cores require at least 160 BW-EP cores.
Want to see what it cost to remain with 10 Broadwell servers? Look at the 2nd chart. It compares 10 vs 8 servers, each with 2 socket Broadwell v4 chips. If you don’t consolidate servers then you are not saving ANY money as the costs are virtually the same.
The article hides the cost of VMware in the software & maintenance category. Not sure why the author categories virtualization as “software”. I consider software to be middleware, appware, etc. I like to use Oracle Enterprise Edition DB. On Intel it licenses the entire server; all cores times a licensing factor of 0.5. At $47,500 per core and 22% maint annually the Sandy Bridge cost for 10 servers with 16 cores equals $3,800,000 + $836,000 each year. If you upgrade those 10 servers to Broadwell with 4 servers with 44 cores each the total Oracle cost would be $4,085,000 and $898,700 each year. Since you’ve already paid the $3.8M & $.9M respectively you’ll only have to cut a new check to Larry for $285,000 in additional license cost plus $62,700 for that years maintenance. Remember to add the $63K to your budget to cover the increase in maintenance for each successive year
Notice the handy guide to compare one Intel generation to another. Looks impressive but it is does this based on the aggregate performance with more cores per socket. Would you expect a 22 core socket to have more performance than 8 cores? It is 2.75X. Low and behold the handy guides says to expect 2.7X increase for Cloud Computing and 2.8X for Enterprise IT….hmmm, 2.75 rounds to 2.8 – you can see the charade and articles like this one only reinforce the game being played by Intel.
Here’s a better guide: Use “.30″… because Nehalem Gainestown thru Broadwell Intel processors the cores achieve a Relative Performance average of .30 per core.
Read my blog inspired by this article to get more details behind this Intel Charade. http://wp.me/p4PWml-1h
Thank you Brett Murphy for revealing the invented realities of Intel system sales propaganda by decomposing disinformation into the rational platform truths.
Assessing first five weeks of E5 26xx v4 channel shipments:
This analyst on Intel disintegrated story problem supply signal cipher volume answer at Westmere, followed by volume answer at Sandy continues Xeon E5 supplies through Ivy, Haswell, Broadwell around 30 million per year capable on Intel supply objective yielding sufficient sweet spot volumes.
EP price is up.
Westmere Gulftown EP – 37,403,588 units at Average Weighed 1K Price $888.69
Sandy E5 26xx – 52,194,648 units at Average Weighed 1K Price $1043
Ivy E5 26xx – 67,935,881 units at Average Weighed 1K Price $1123
Haswell E5 26xx – 35,326,658 units at Average Weighed 1K Price $1040
Broadwell E5 26xx – 30,000,000 units Average Weighed 1K Price currently $1172
Current Broadwell v4 by core grade split
2623 7.17%
2637 0.16
4C 7.33%
2603 8.15%
2643 5.98
6C 14.12%
2608L 0.00%
2609 8.54
2620 9.64
2667 0.18
8C 18.35%
2618L 0.00%
2630L 0.02
2630 8.62
2640 7.29
2689 0.01
10C 15.94%
2628L 0.01%
2650 7.82%
2687W 3.68%
12C 11.51%
2648L 0.02%
2650L 0.00
2658 0.00
2660 7.44
2680 8,81
2690 8.07
14C 24.34%
2683 0.32%
2697A 0.00
16C 0.32%
2695 0.79%
2697 6.43
18C 7.23%
2698 0.22%
20C 0.22%
2696 0.25%
2699 0.38
22C 0.63%
1K Average Weighed Price of Haswell v3 verse 1K AWP of Broadwell v4 reveals how Intel wants customers to move up and step up to higher core counts. In one example note 12C v3 v 16C v4.
4C $723 v $455
6C $444 v $779
8C $650 v $381
10C $1241 v $792
12C $1843 v $1478
14C $2389 v $1767
16C $2978 v $1846
18C $4056 v $2671
1K AWP v4 only
20C $3226
22C $4115
First Tier Discount Broker/Dealer Estimate 20 to 35%
Intel design production cost on a good yield day.
4C $57
6C $96
8C $96
10C $98
12C $183
14C $220
16C $230
18C $331
20C $401
22C $511
Mike Bruzzone, Camp Marketing
Visual Configuration comparison map does a great difference. It show all 30 servers of Dell, IBM, HP, Fujitsu and Acer. The picture logical format is easy to understand. This single picture allows you compare these servers. The diagram does contain links to more detailed documents.