

The bi-annual list of the Top 500 fastest supercomputers on the planet is in, and while there might not be any earth-shattering news at the peak of the charts, a drilldown of the results does show some key developing trends in high performance computing.
Despite the lack of surprise systems or new groundbreaking architectures soaring to the top, this is what might be the last list where stagnation is the defining characteristic. As will be outlined below, the tipping point is near, and 2016 is set to be an exciting year–at least based on some of the less overt themes on this last list of 2015. As we also described this morning, one of the most notable trends is geographic with China tripling its count on the Top 500 in just over four months.
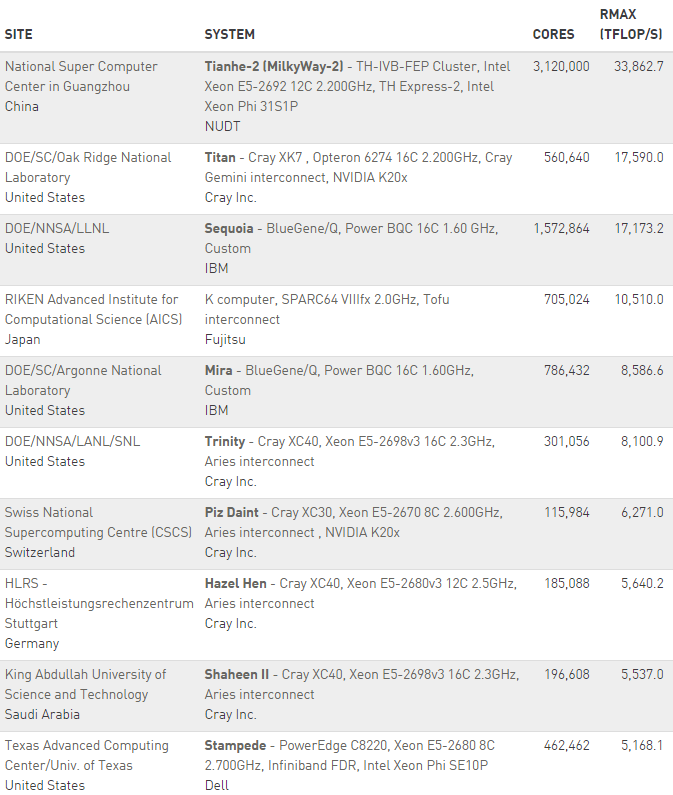
In terms of the results themselves, the top ten offers little in the way of the unexpected, but does highlight the growing trend toward huge post-petaflop performance requirements to find a spot with the entry point to top ten rankings above five petaflops of peak performance. For those who follow the Top 500 results, which are announced at the two biggest supercomputing events of the year—one at ISC in Germany (in June) and again at the Supercomputing Conference (SC), the two newcomers in the top ten are readily apparent. The NNSA’s Cray “Trinity” supercomputer, which made its grand debut at #6 on the list, sets the stage for more massive Department of Energy machines, which will hit the floor over the next two years. Another Cray system, the “Hazel-Hen” in Stuttgart, also made the top ten.
For those interested, details on the top ten that were announced over the summer during the ISC rankings can be found here. The most notable aspect of the list this November is the relative stillness and seeming stagnation across a number of metrics. Even where there are trends on the rise (in accelerators or overall system peak performance), they are not climbing the slopes with any urgency. In many ways, this Top 500 feels (and looks when visualized, as below) like a wide landing of a steep staircase—a place to rest before scaling the unseen heights ahead. For instance, take a look below at the overall system performance curve for a moment.
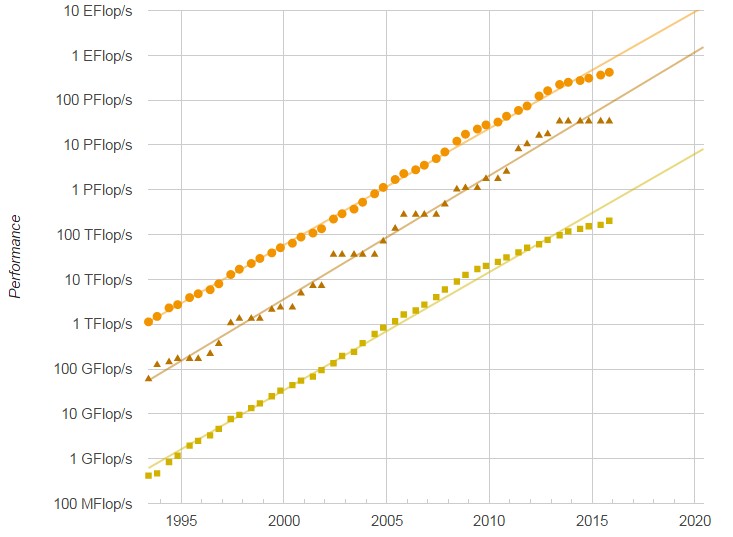
The tapering off of the aggregate system performance across the list is, as clearly seen here, not something entirely new and can be directly traced back to big changes in system architecture and economic factors. What’s happening over the last couple of years in terms of the leveling off can be attributed to both; economically closer to the beginning of the flattening, but in the last year, there has been a waiting game for funding to meet the needs of new systems that will outfitted with technologies worth waiting for, including Knights Landing, Omni-Path, and the latest Broadwell generation of chips—all of which are set to disrupt the flat line.
On that note, there are a very high number of systems that are three years or older, which means that the replacement rate, now at a staggering low 25%, will also see an uptick. With the addition of far more cores, these fresh systems that will be validated once parts begin arriving in the first quarter of 2016 through the first half of the year, will send a new spike into the graph above—highlighting once again how architecture refreshes can alter a list dramatically.
With this, the top ten is expected to change significantly as well. Between now and the November 2016 listing, for instance, we will see some of the CORAL pre-exascale machines start appearing on this list. And this is just in the United States. Other massive machines in China, Japan, and throughout Europe are slated to arrive sometime in 2016 (and a few we are aware of that will vie for top ten billing in 2017 and definitely 2018—the years when the list will take on a new life of its own). For instance, by the end of next year, one of the CORAL systems that will serve as a precursor to the massive Aurora supercomputer, which is expected to be capable of a peak 180 or more petaflops, Theta, will hit the floor with 8.5 petaflops—centering it in the current top ten. Other machines, including the forthcoming Sierra and Summit supercomputers are also expected to be complete by 2017. To put these machines in perspective, consider that the current top system–by a longshot, no less–hits peak performance of over 33 petaflops.
Even with big funding efforts at the core of a new spike in Top 500 activity, without compelling new architectures and more powerful cores, aggregate performance will only scale to a certain limit. What is notable about this list, at least on the refresh and stagnation point, are how (relatively) dated the architectures are. For instance, take a look below at the breakdown of architectures from this November’s list by processor type.
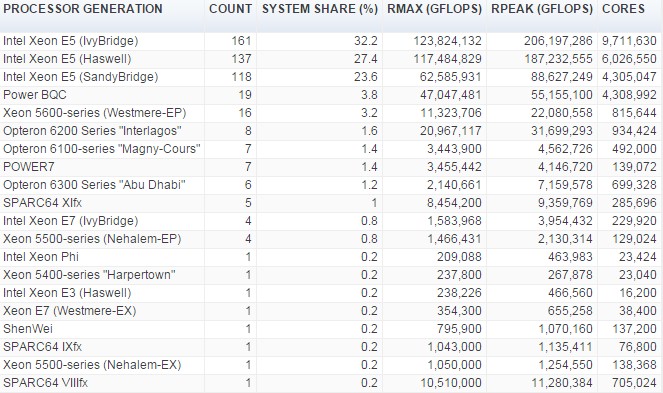
As can be clearly seen, the Top 500 list is operating on technology that is at least a couple of years old on the Ivy Bridge side and while some systems have moved to Haswell CPUs, we can expect by the summer list, Haswell will have possibly overtaken Ivy Bridge. It’s not clear yet whether there will be any validated machines on the summer list featuring the new Broadwell chips (likely not) but by next November, a comparative analysis between now and then on the processor generation will have shown quite a shift.
Additionally, we will see Knights Landing chips begin to appear on the list by SC16, and the question there will be where those fit. They are not necessarily a co-processor or accelerator since they do not operate as a discrete companion processor. One could expect they will simply be listed under “processors” leaving GPUs (and perhaps even some FPGA machines if we are lucky enough to see those deployed in the wild at this kind of scale) in the accelerator/co-processor camp. And peaking of accelerators, there has been moderate change in the number of systems using Xeon Phi or Nvidia GPU cards. Just a year ago, one might have anticipated that the Xeon Phi corprocessor would have seen considerable uptick, but back again to the point about upcoming refreshes–it is quite probable that many centers are holding off on the Xeon Phi coprocessor in favor of waiting on Knights Landing for a more integrated approach to accelerated computing.
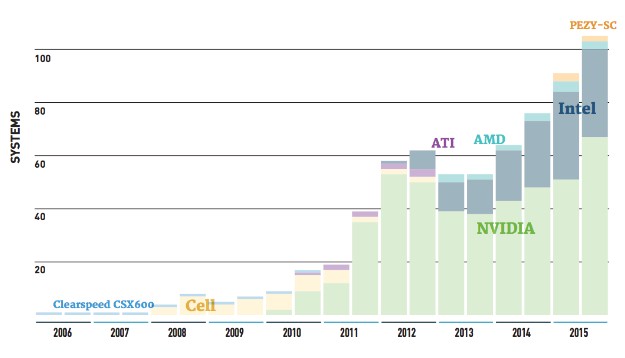
Accelerators have dominated the supercomputing story over the last several years. The current top machine in the world, Tianhe-2, is outfitted with Xeon Phi coprocessors and the second system, Titan at Oak Ridge National Lab, uses GPUs. Overall, 104 machines on the list are using one or the other, a bump of 17 new machines since this summer’s list. Of those, 66 use GPUs, 27 use Xeon Phi, and a handful of other machines are making use of the ATI Radeon chips.
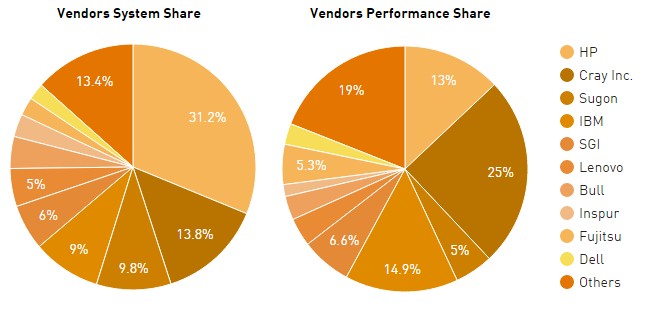
What is interesting on this list is how the vendor ecosystem is shaping up. In a companion piece this morning that looked at the role Chinese vendors are playing in the list, we noted some shifts there, particularly with Sugon. While their story is one to watch this SC, Cray has had a very strong showing. They currently claim almost 25% of the performance share, with IBM a distant second with almost 15% (a number that will shrink as the remaining BlueGene systems are replaced and government and other organizations, wary of doing business with Chinese vendor Lenovo) fall off the list. HP is just below IBM with 12.9% of the performance share of the Top 500, which is down from 14.2 percent from the summer rankings.
To put this tapering off of the list’s overall performance in context, recall that from 1994 to 2008, it grew by around 90 percent each year but is now more in the 50 percent growth range. While it might not get back to the point of massive growth seen in earlier years, we are at the landing—and there are dramatic heights above yet to scale.


Real-World HPC Gets the Benchmark It Deserves
While nothing can beat the notoriety of the long-standing LINPACK benchmark, the metric by which supercomputer performance is gauged, there is ample room for a more practical measure. It might not garner the same mainstream headlines as the Top 500 list of the world’s largest systems, but a new benchmark …
Dennard Scaling Demise Puts Permanent Dent in Supercomputing
When the TOP500 list of the world’s most powerful supercomputers comes out twice a year, the top-ranked machines receive the lion’s share of attention. It is, after all, where the competition is most intense. But if people had given more scrutiny to the bottom of the list, they would have …
The Widening Gyre Of Supercomputing
The twice-annual ranking of distributed computing systems based on the Linpack parallel Fortran benchmark, a widely used and sometimes maligned test, is as much a history lesson as it is an expectation always looking forward, with anticipation, to the next performance milestones in high performance computing. As we have pointed …
Comments are closed.
“The tapering off of the aggregate system performance across the list is, as clearly seen here,” is not as clear as you imagine, because you have three plots in this figure, and they are not labeled.
Then, in the final pie chart, the colors are so similar that it was impossible for me to puzzle out e.g. IBM/SGI/Lenovo.